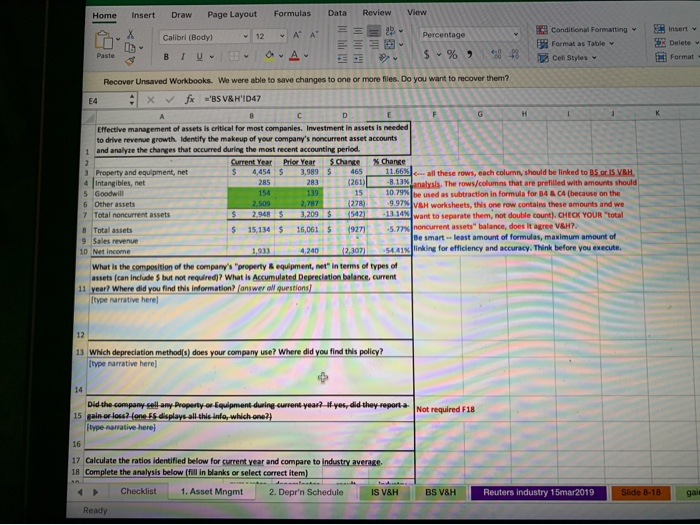
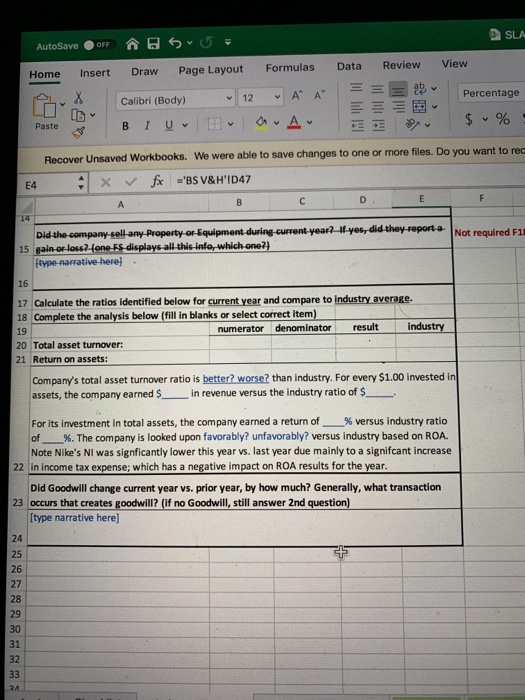
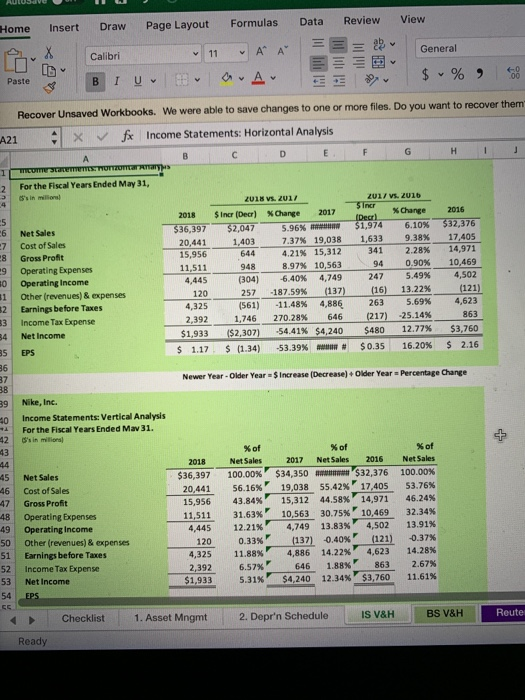
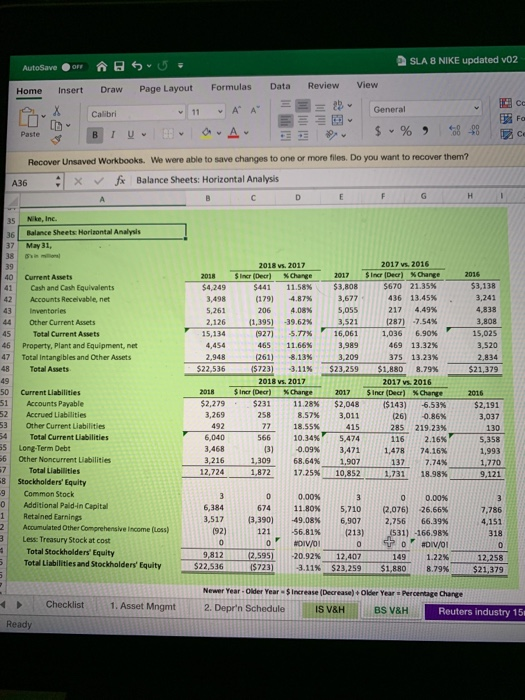
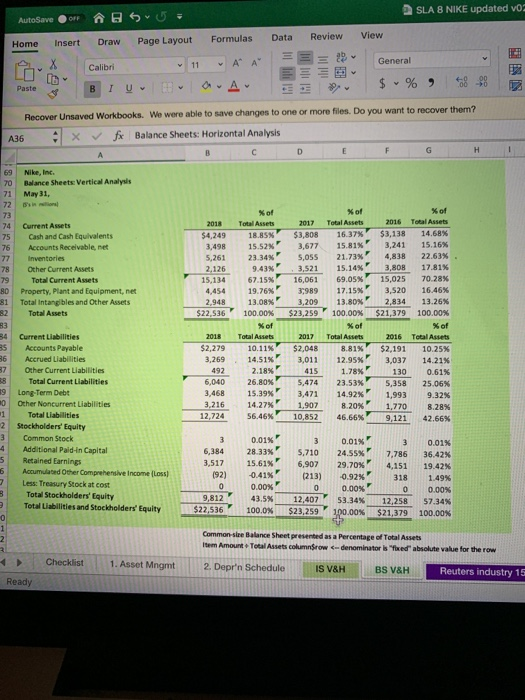
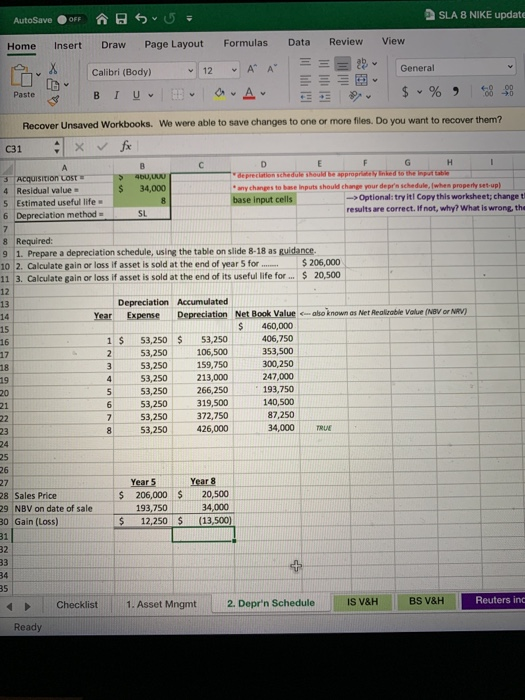
Home Insert Draw Page Layout Formulas Data Review View percentage 29 ES 2 Calibri (Body) 12 A A * BLUE OA 13 Conditional Formatting Format as Table Cell Styles 2 Insert Delete Format 5 % + Recover Unsaved Workbooks. We were able to save changes to one or more files. Do you want to recover them? X f x -'BS V&H'ID47 E4 Effective management of assets is critical for most companies. Investment in assets is needed to drive revenue growth. Identify the makeup of your company's nexurrent asset accounts Y non current asset accounts 1 and analyze the changes that occurred during the most recent accounting period Current Year Prior Year Schance X Change 3 Property and equipment, net 5 4,454 S 3,989 $ 465 11.66%... all these rows, each column, should be linked to BS or IS VEH 4 intangibles, net 285 283 (261) 8.13% analysis. The rows/columns that are prefilled with amounts should 5 Goodwill 154 139 15 10.79% be used as subtraction in formula for 64 & 04 (because on the 6 Other assets 2509 277 278) 9.97XIV worksheets, this one row contains these amounts and we 7 Total noncurrent assets $ 2,948 $ 3,209 S 542) 13.14% want to separate them, not double count). CHECK YOUR "total 8 Total assets S 15.134 $ 16,061 $ 5 1927 .7xnoncurrent assets" balance, does it agree VAH? 9 Sales revenue Be smart least amount of formulas, maximum amount of 10 Net Income 1,933 4,240 2.107 541 linking for efficiency and accuracy. Think before you execute. What is the composition of the company's "property & equipment, et in terms of types of assets can include but not required)? What is Accumulated Depreciation balance, current 11 year? Where did you find this information? answer all questions type narrative here) 13 WNch depreciation method(s) does your company use? Where did you find this polley? type narrative here] Not required F18 Did the company sell any Property or Equipment during current year? #yes, did they reporta 15 gain or loss? (one. Es displays all this info, which one? type arrative here! 17 Calculate the ratios identified below for current year and compare to Industry average 18 Complete the analysis below (fill in blanks or select correct item) Checklist 1. Asset Mngmt 2. Deprin Schedule IS V& H Ready B S V&H Reuters Industry 16mar2019 Slide 8-16 gait SLA AutoSave OFF View Home Insert @ S S = Draw Page Layout Calibri (Body) 12 I U - D- Formulas A A a. A Data = E X Review = B 9 Percentage % $ Paste & B E4 Recover Unsaved Workbooks. We were able to save changes to one or more files. Do you want to rec x fx ='BS V&H'ID47 . A Did the company sell any Property or Equipment during current year? If yes, did they report.a. 15 gain or loss? fone. Es displays all this info, which one?) type narrative here . 17 Calculate the ratios identified below for current year and compare to Industry average. 18 Complete the analysis below (fill in blanks or select correct item) numerator denominator result industry 20 Total asset turnover: 21 Return on assets: Company's total asset turnover ratio is better? worse than industry. For every $1.00 invested in assets, the company earned in revenue versus the industry ratio of $ For its investment in total assets, the company earned a return of _% versus Industry ratio of %. The company is looked upon favorably? unfavorably? versus industry based on ROA. Note Nike's NI was signficantly lower this year vs. last year due mainly to a signifcant increase 22 in income tax expense; which has a negative impact on ROA results for the year. Did Goodwill change current year vs. prior year, by how much? Generally, what transaction 23 occurs that creates goodwill? (if no Goodwill, still answer 2nd question) [type narrative here) LUB Home Insert Draw Page Layout Formulas Data Review View Calibri 11 A A = = General EE Paste BI U A E $ % Recover Unsaved Workbooks. We were able to save changes to one or more files. Do you want to recover them A21 x fx Income Statements: Horizontal Analysis A B C D E F G H J 1 comesTICS NUTZUMAT For the Fiscal Years Ended May 31, S's in million 2018 vs. 2017 2017 V.2016 Since 2018 change Sinar (Dec) * Change 2017 Der 2016 Net Sales $36,397 $2,047 5.96% $1,974 6.10% $32,376 Cost of Sales 20,441 1,403 7.37% 19,038 1,633 9.38% 17,405 Gross Profit 15.956 644 4.21% 15,312 341 2.28% 14,971 Operating Expenses 11,511 948 8.97% 10,563 94 0.90% 10,469 Operating Income 4,445 (304) 6.40% 4,749 247 5.49% 4,502 Other (revenues) & expenses 120 257 187.59% (137) (16) 13.22% (121) Earnings before Taxes 4,325 (561) 11.48% 4,886 263 5.69% 4,623 Income Tax Expense 2.392 1,746 270.28% 646 (217) -25.14% 863 Net Income $1,933 ($2,307) -54.41% $4,240 5480 12.77% $3.760 EPS $ 1.17 $ (1.34) 53.39% # $0.35 16.20% $ 2.16 UN ai 9 OM Newer Year-Older Year Increase (Decrease) + Older Year = Percentage Change o Nike, Inc. Income Statements: Vertical Analysis For the Fiscal Years Ended Mav 31. B's in milions Net Sales Cost of Sales Gross Profit Operating Expenses Operating Income Other (revenues) & expenses Earnings before Taxes Income Tax Expense Net Income EPS 2018 $36,397 20,441 15,956 11,511 4,445 120 4,325 2,392 $1,933 % of Net Sales 100.00% 56.16%' 43.84% 31.63% 12.21% 0.33% 11.88% 6.57% 5.31% % of 2017 Net Sales 2016 $34,350 a $32,376 19,038 55,42% 17,405 15,312 44.58% 14,971 10,563 30.75% 10,469 4,749 13.83% 4,502 (137) 0.40%" (121) 4,886 14.22% 4,623 646 1.88x' 863 $4,240 12.34% $3,760 % of Net Sales 100.00% 53.76% 46.24% 32.34% 13.91% 0.37% 14.28% 2.67% 11.61% 54 Checklist 1. Asset Mngmt 2. Depr'n Schedule I S V&H BS V&H Reute! Ready SLA 8 NIKE updated vo2 AutoSave Home Insert A $ 5- Page Layout 11 Draw Calibri View Formulas A A Data = Review = 29 General Co Fo 0 Pastes BTU B O A E P $ % 9 68 58 Tac Recover Unsaved Workbooks. We were able to save changes to one or more files. Do you want to recover them? A36 x fx Balance Sheets: Horizontal Analysis 35 Nike, Inc Balance Sheets Horizontal Analysis May 31, 2018 $4,249 Current Arts Cash and Cash Equivalents Accounts Receivable, net Inventories Other Current Assets Total Current Assets Property. Plant and Equipment, net Total Intangibles and Other Assets Total Assets $3,138 3,241 4,838 3.808 15.025 45 5,261 2.126 15,134 4,454 2.948 $22,536 2018 vs. 2017 Sinar (Decr] Change $441 11.58% (179) 4.87% 206 4.08% 1,395) 39.62% 927] 5.77% 465 11.66% (261) 8.13% $723) -3.11% 2018 vs. 2017 Siner (Deer) Change $231 11.28% 258 8.57% 18.55% 10.34% 0.09% 1.309 68.64% 1,872 17.25% 2017 vs. 2016 Since Decr) % Change $670 21.35% 3,677 436 13.45% 5.055 217 4.49% 3.521 (287) -7.54% 16,061 1,036 6.90% 3,989 469 13.32% 3.209 375 13.23% $23,259 $1,880 8.79% 2017 vs 2016 2017 Sinar (Dec Change $2,048 $143) -6.53% 3,011 (26) 0.86% 415 285 219.23% 5,474 1 16 2.16% 3,471 1.478 74.16% 1.907 137 7.74% 10.852 1.731 18.98% 3,520 2.834 $21,379 2015 2018 $2,279 3,269 $2,191 3,037 55 6,040 3.468 3,216 12.724 5,358 1,993 9.121 Current Liabilities Accounts Payable Accrued Liabilities Other Current Liabilities Total Current Liabilities Long-Term Debt Other Noncurrent Liabilities Total Liabilities Stockholders' Equity Common Stock Additional Pald-in Capital Retained Earnings Accumulated Other Comprehensive Income (Loss) Less: Treasury Stock at cost Total Stockholders' Equity Total Liabilities and Stockholders' Equity 674 (92) 0.00% 11.80% 49.08% -56.81% #DIV/01 20.92% 3.11% 6,384 3,517 3,390) 121 0 9,8122 .595) $22,536 111 1$723) 7,786 4.151 318 0 0.00% (2,076) -26.66% 2,756 66.39% 5 (531) -166.98% EE TO #DIV/01 1 49 1.22% $1,880 8.79% 5,710 6,907 (213) 12131 O 12,407 $23,259 12,258 $21,379 Checklist 1. Asset Mngmt Newer Year-Older Year - Sincrease (Decrease) Older Year Percentage Change 2. Depr'n Schedule IS V&H BS V&H Reuters industry 15 Ready SLA 8 NIKE updated vo View AutoSaveF 35 Home Insert Draw Page Layout P X Calibri 1 Paste BTUA Formulas A A Data Review = EE # General $ % ) 8-28 Recover Unsaved Workbooks. We were able to save changes to one or more files. Do you want to recover them? A36 x f x Balance Sheets: Horizontal Analysis 69 Nike, Inc. 70 Balance Sheets: Vertical Analysis May 31, 72 Siim Xor Current Assets Cash and Cash Equivalents Accounts Receivable.net Inventories Other Current Assets Total Current Assets Property, Plant and Equipment, net Total Intangibles and Other Assets Total Assets 2018 $4,249 3,498 5,261 2,126 15,134 Total Assets 18.85% 15.52% 23.34% 9.43% 67.15% 19.76% 13.08% 100.00% 2017 $3,808 3,677 5,055 3,521 16,061 3989 3,209 $23,259 % of Total Assets 16.37% 15.81% 21.73% 15.14% 69,05% 17.15% 13.80X 100.00% 2.948 $22,536 % of 2016 Total Assets $3,138 14.68% 3,241 15.16% 4,838 22.63% 3,80B 17.81% 15,025 70.28% 3,520 16.46% 2,834 13.26% $21.379 100.00% % of 2016 Total Assets $2,191 10.25% 3,037 14.21% 130 0.61% 5,358 25.06% 1,993 9.32% 1,770 8.28% 9.121 42.66% Nof Xof 2018 $2,279 3,269 492 Total Assets 10.11% , 14.51% 2.18% 26,80% 15.39% 14.27% 56.46% 2017 $2,048 3,011 415 5,474 3,471 1.907 10,852 6,040 3,468 3,216 12,724 Total Assets 8.81% 1 2.95% 1.78% 23.53% 14.92% 8.20% 46,66% 19 Current Liabilities Accounts Payable Accrued Liabilities Other Current Liabilities Total Current Liabilities Long-Term Debt Other Noncurrent Liabilities Total Liabilities Stockholders' Equity Common Stock Additional Paid in Capital Retained Earnings Accumulated Other Comprehensive Income (Loss) Less: Treasury Stock at cost Total Stockholders' Equity Total Liabilities and Stockholders' Equity 6,384 3,517 0.01% 36.42% 19.42% 192) 0.01% 28.33% 15.61% 0.41%" 0.00% 43.5% 100.0% 5.710 6,907 (213) 0 12,407 $23,259 0.01% 24.55% 29.70% 0.92% 0.00% 53.34% 100.00% 7,786 4,151 318 0 12,258 $21,379 1.49% 0.00% 57.34% 100.00% $22.536 Common-stre Balance Sheet presented as a Percentage of Total Assets Item Amount Total Assets columnsrow - denominator s ed absolute value for the row Checklist 1. Asset Mngmt 2. Deprn Schedule IS V&H BS V&H Reuters industry 15 Ready AutoSaver S5 = SLA 8 NIKE upda Home Insert Draw Page Layout Formulas Data Review View Calibri (Body) 12 A A E = 29 General $ % , 99 Recover Unsaved Workbooks. We were able to save changes to one or more files. Do you want to recover them? 031 x v fx > $ 34,000 ACQUISITION LOST 4 Residual value Estimated useful life Depreciation method depreciation schedule h e progr e the any changes to be inputs should change your dear schedule, whes properly set-up) base input cells -> Optional: try itl Copy this worksheet; change results are correct. If not, why? What is wrong, th Required: 9 1. Prepare a depreciation schedule, using the table on slide 8-18 as guidance. 10 2. Calculate gain or loss if asset is sold at the end of years for ....... $206,000 11 3. Calculate gain or loss if asset is sold at the end of its useful life for... $ 20,500 ho known as Rarable ValueNavor MARIA Depreciation Accumulated Year Expense Depreciation Net Book Value $ 460,000 1 $ 53,250 $ 53,250 406,750 2 53,250 106,500 353,500 53,250 159,750 300,250 53,250 213,000 247,000 53,250 266,250 193,750 53,250 319,500 140,500 53,250 372,750 87,250 53,250 426,000 34,000 $ $ 8 Sales Price 9 NBV on date of sale O Gain (Loss) Year 5 206,000 193,750 12,250 Year 8 20,500 34,000 (13,500) $ S Checklist 1. Asset Mngmt 2. Deprin Schedule IS V&H BS V&H Reuters in Ready