

Question
home / study / business / accounting / questions and answers / fraud examination - 4 edition -case study 4 - chapter ... Question: Fraud
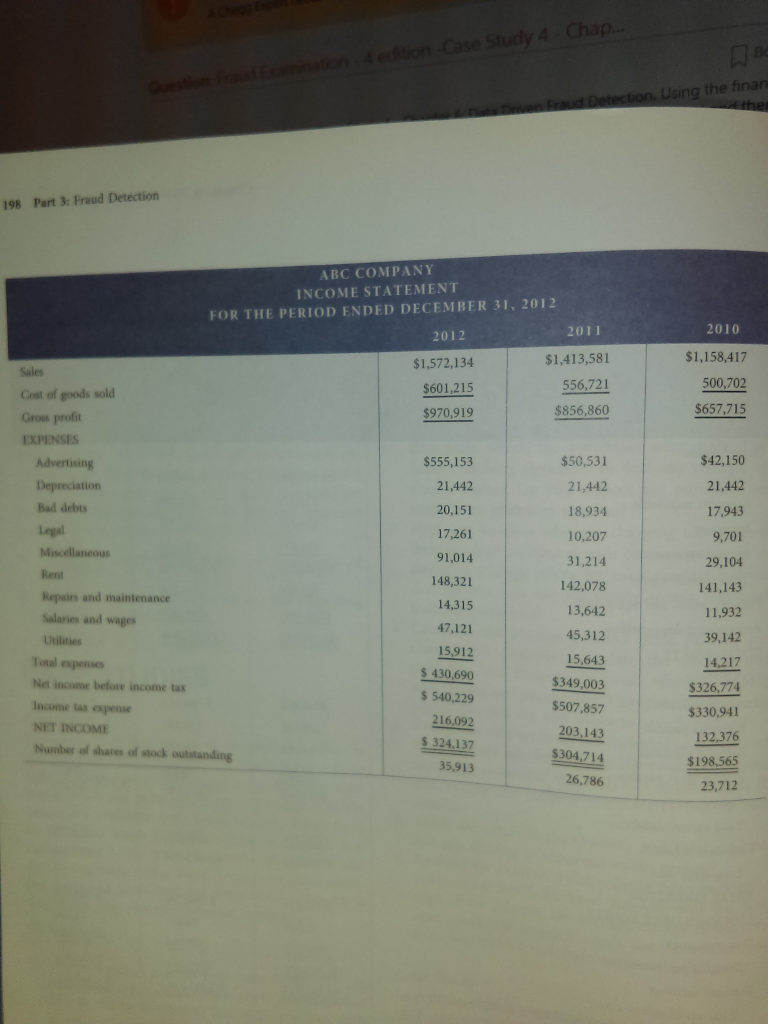
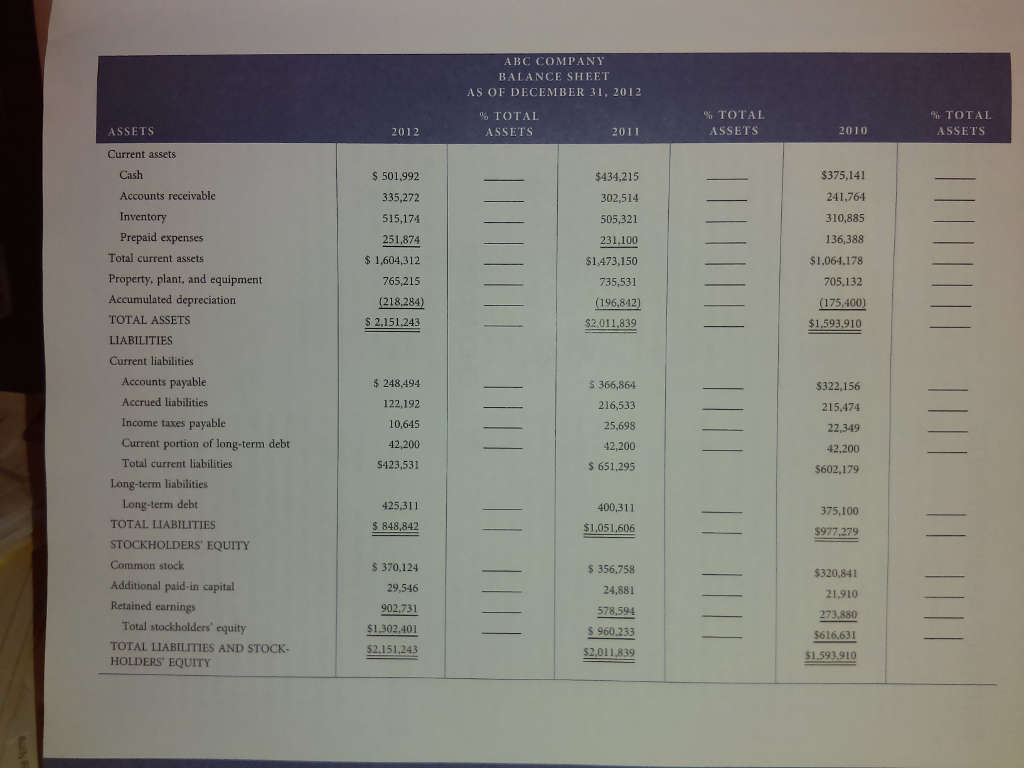
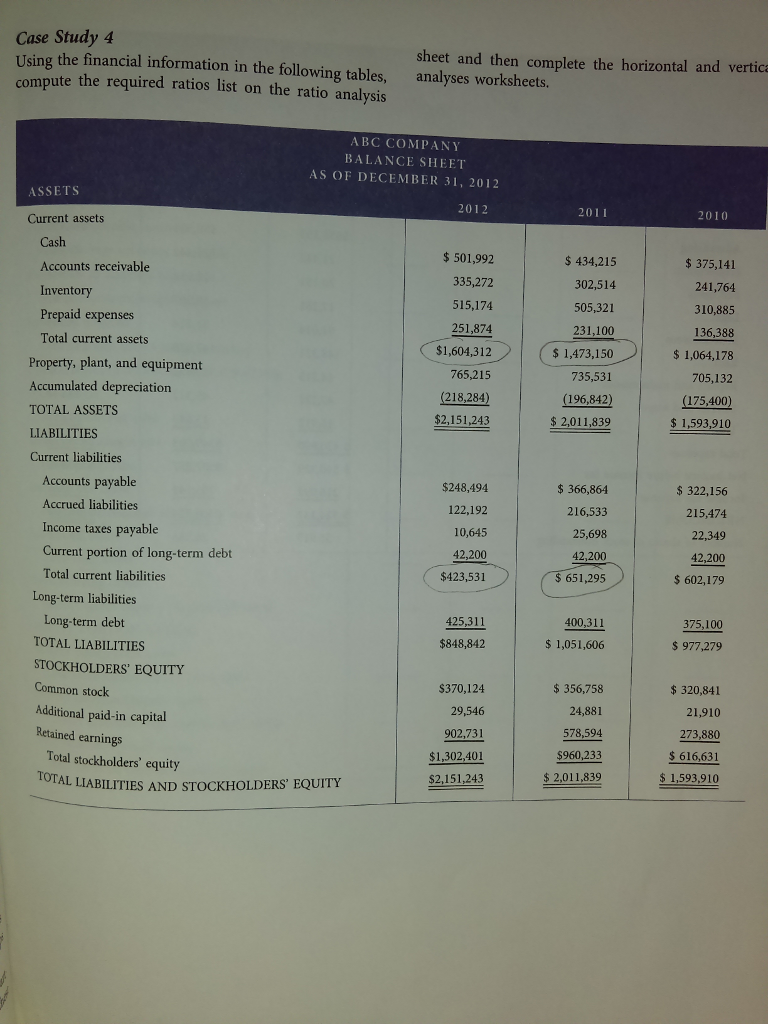
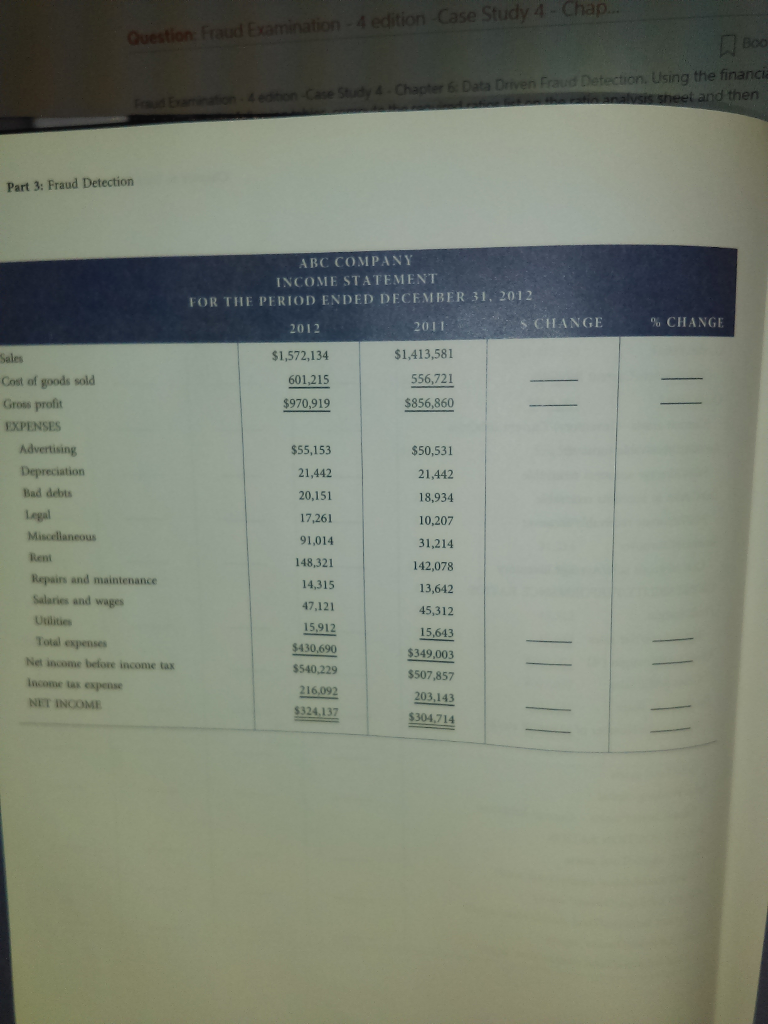
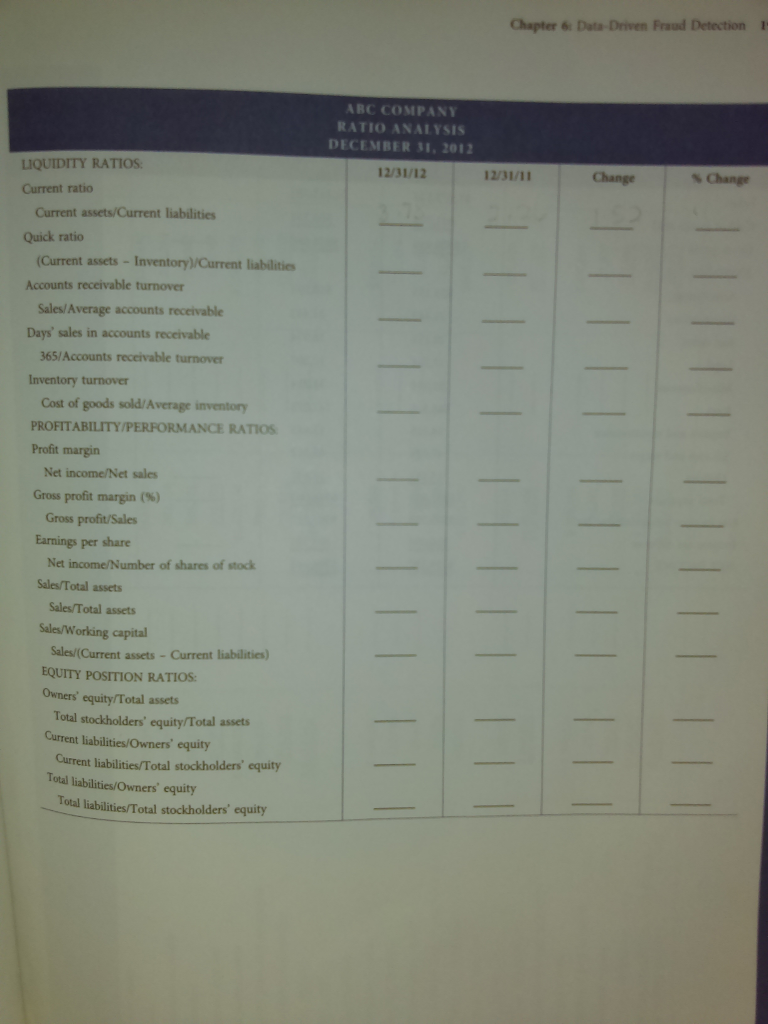 home / study / business / accounting / questions and answers / fraud examination - 4 edition -case study 4 - chapter ... Question: Fraud Examination - 4 edition -Case Study 4 - Chap... Bookmark tection. Using the finan 198 Part 3: Fraud Detection ABC COMPANY INCOME STATEMENT FOR THE PERIOD ENDED DECEMBER 31, 2012 2011 2010 2012 $1,158,417 $1,413,581 $1,572,134 500,702 556,721 $601,215 Cost of goods sold $657,715 $856,860 $970,919 Gross profit $50,531 $42,150 $555,153 21,442 21,442 21,442 Bad debts 20,151 18,934 17,943 17,261 10,207 9,701 91,014 31,214 29,104 148,321 142,078 141,143 Repairs and maintenance 14,315 13,642 11,932 halaries and wages 47,121 45,312 39,142 15,912 5,643 Total expenses 14,2 430,690 $349,003 Net income before income tax $326,774 540,229 Income tax expense $507,857 $330,941 203,143 132,376 324,137 Number of shares of stock outstanding $304,714 $198,565 35,913 26,786 23,712 Fraud Examination - 4 edition -Case Study 4 - Chapter 6: Data Driven Fraud Detection. Using the financial information in the following tables, compute the required ratios list on the ratio analysis sheet and then complete the horizontal and vertical analses worksheet. ABC Company Show transcribed image text View comments (1) SOMEONE ANSWERED THIS BUT FORGOT OR LEFT OUT, TWO OF THE ANSWERES FOR TWO QUESTIONS; TOTAL STOCKHOLDERS' EQUITY ON THE BALANCE SHEET AND ALSO THE EARNINGS PER SHARE ON THE RATIO ANALYSIS SHEET. CAN SOMEONE PLEASE ANSWER THESE QUESTIONS CORRECTLY PLEASEEEEEEEE!
Step by Step Solution
There are 3 Steps involved in it
Step: 1

Get Instant Access to Expert-Tailored Solutions
See step-by-step solutions with expert insights and AI powered tools for academic success
Step: 2

Step: 3
Ace Your Homework with AI
Get the answers you need in no time with our AI-driven, step-by-step assistance
Get Started
Guide To Financial Audit In Life And Health Insurance
Authors: Naser-Eddine Nebbache
1st Edition
6205873397, 978-6205873397