Answered step by step
Verified Expert Solution
Question
1 Approved Answer
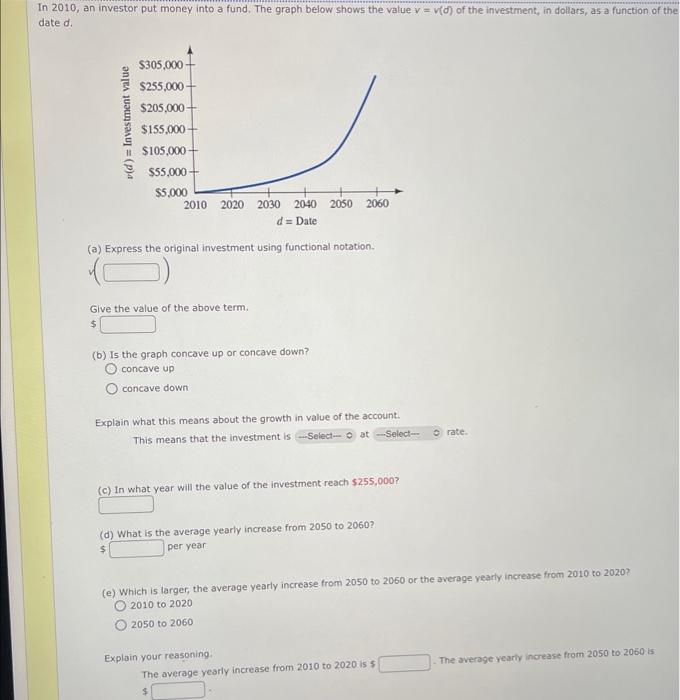
homework 1.3 functions given by graphs In 2010 , an investor put money into a fund, The graph below shows the value v=v(d) of the
homework 1.3 functions given by graphs 

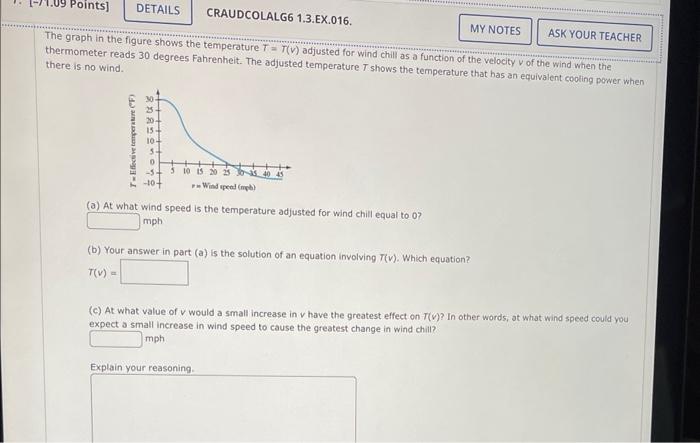
In 2010 , an investor put money into a fund, The graph below shows the value v=v(d) of the investment, in dollars, as a function of the date d. (a) Express the original investment using functional notation. Give the value of the above term. $ (b) Is the graph concave up or concave down? concave up concave down Explain what this means about the growth in value of the account. This means that the investment is rate. (c) In what year will the value of the investment reach $255,000 ? (d) What is the average yearly increase from 2050 to 2060? per year. \$ (e) Which is larger, the average yearly increase from 2050 to 2060 or the average yearly increase from 2010 to 2020 ? 2010 to 2020 2050 to 2060 Explain your reasoning. The average yearly increase from 2010 to 2020155 The average yeariv increase from 2050 to 2060 is The graph in the figure shows the temperature T=T(v) adjusted for wind chill as a function of the velocity v of the wind when the thermometer reads 30 degrees Fahrenheit. The adjusted temperature T shows the temperature that has an equivalent cooling power when there is no wind. (a) At what wind speed is the temperature adjusted for wind chill equal to 0 ? mph (b) Your answer in part (a) is the solution of an equation involving T(v). Which equation? T(v)= (c) At what value of v would a small increase in v have the greatest effect on T(v) ? In other words, st what wind speed could you expect a small increase in wind speed to cause the greatest change in wind chill? mph Explain your reasonina. In 2010 , an investor put money into a fund, The graph below shows the value v=v(d) of the investment, in dollars, as a function of the date d. (a) Express the original investment using functional notation. Give the value of the above term. $ (b) Is the graph concave up or concave down? concave up concave down Explain what this means about the growth in value of the account. This means that the investment is rate. (c) In what year will the value of the investment reach $255,000 ? (d) What is the average yearly increase from 2050 to 2060? per year. \$ (e) Which is larger, the average yearly increase from 2050 to 2060 or the average yearly increase from 2010 to 2020 ? 2010 to 2020 2050 to 2060 Explain your reasoning. The average yearly increase from 2010 to 2020155 The average yeariv increase from 2050 to 2060 is The graph in the figure shows the temperature T=T(v) adjusted for wind chill as a function of the velocity v of the wind when the thermometer reads 30 degrees Fahrenheit. The adjusted temperature T shows the temperature that has an equivalent cooling power when there is no wind. (a) At what wind speed is the temperature adjusted for wind chill equal to 0 ? mph (b) Your answer in part (a) is the solution of an equation involving T(v). Which equation? T(v)= (c) At what value of v would a small increase in v have the greatest effect on T(v) ? In other words, st what wind speed could you expect a small increase in wind speed to cause the greatest change in wind chill? mph Explain your reasonina 

Step by Step Solution
There are 3 Steps involved in it
Step: 1

Get Instant Access to Expert-Tailored Solutions
See step-by-step solutions with expert insights and AI powered tools for academic success
Step: 2

Step: 3

Ace Your Homework with AI
Get the answers you need in no time with our AI-driven, step-by-step assistance
Get Started


