Question: = Homework: Ch 8.1 Simple Regression Question 2, 13.2.2 Part 1 of 4 HW Score: 0%, 0 of 7 points O Points: 0 of 1
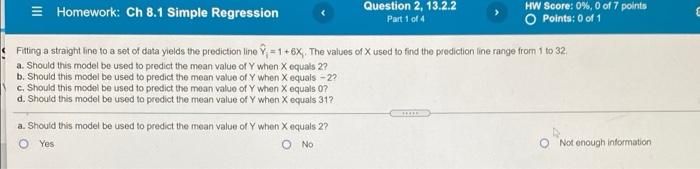
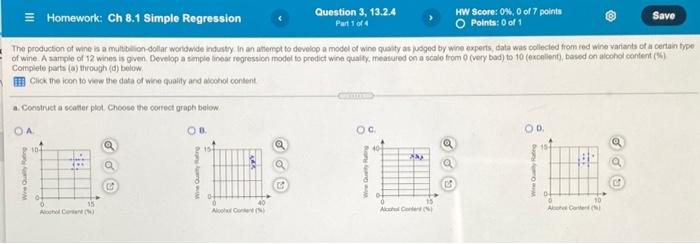
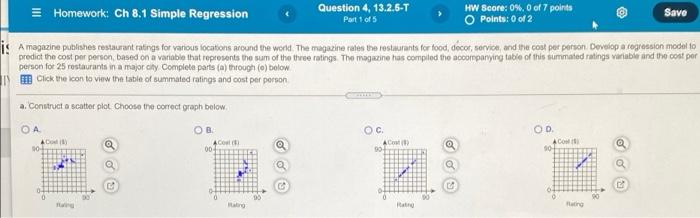
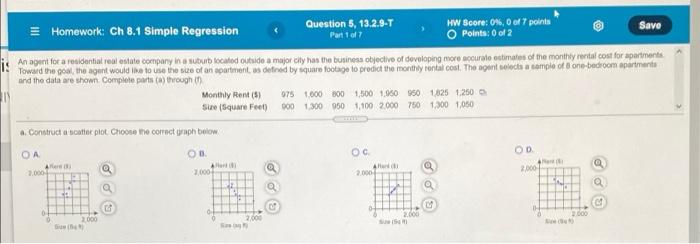
= Homework: Ch 8.1 Simple Regression Question 2, 13.2.2 Part 1 of 4 HW Score: 0%, 0 of 7 points O Points: 0 of 1 Fitting a straight line to a set of data yields the prediction line 7; = 1 +6x, The values of X used to find the prediction line range from 1 to 32 a. Should this model be used to predict the mean value of Y when X equals 2? b. Should this model be used to predict the mean value of Y when X equals - 2? c. Should this model be used to predict the mean value of Y when X equals 0? d. Should this model be used to predict the mean value of Y when X equals 31? a. Should this model be used to predict the mean value of Y when X equals 2? Yes No Not enough information Homework: Ch 8.1 Simple Regression Question 3, 13.2.4 HW Score: 0%, 0 of 7 points Part 1 of 4 Points: 0 of 1 Save The production of wine is a mutbalion-dollar worldwide Industry in an attempt to develop a model of wine quality as judged by wine experts, data was collected from red wine variants of a certain type of wine. A sample of 12 wines is given Develop a simple linear regression model to predict wine quality measured on a scale from overy bad) to 10 (excellent), based on cohol content (5) Complete parts (a) through (d) bolow Click the icon to view the data of wine quality and cohol content a. Construct a scatter plot Choose the correct graphi below OB OG 00 104 o 35 AN o 10 Accord AN Alicho Homework: Ch 8.1 Simple Regression Question 4, 13.2.6-T Part 1 of 5 HW Score: 0% 0 of 7 points Points: 0 of 2 Save is A magazine publishes restaurant ratings for various locations sound the world. The magazine rates the restaurants for food, decor service, and the cool per person. Develop a regression model do predict the cost per person, based on a variable that represents the sum of the three ratings. The magazine has compiled the accompanying table of this summated ratings variable and the cost per person for 25 restaurants in a major city Complete parts (a) through (o) bolow Dm Click the con to view the table of summated ratings and cost per person a. Construct a scatter plot. Choose the correct graph below. AD 30 OB 4 Colt 007 OC AC 90 OD ACO SO Rating = Homework: Ch 8.1 Simple Regression Question 5, 13.2.9-7 HW Score: 0%, 0 of 7 points Save Pa 1017 Points: 0 of 2 is an agent for a readertad real estate company in a subuit located outuido a major city has the business objective of developing more accurato estimates of the monthly rental cost for apartment Toward the goal, the agent would like to use the size of an apartments fred by square footage to predict the monthly rental cost. The agent selects a sample of one bedroom apartments and the data are shown Complete parts through ) Monthly Rent (5) 075 1000000 1500 1.950 950 1625 1.250 Size Square Feet) 900 1,300 950 1.100 2.000 750 1,300 1,050 Construct a cathok plot. Choose the correct graph below) OB . OD AR 2000 3.000 2.000 oo 200 2.000 3000 2000 2.000 = Homework: Ch 8.1 Simple Regression Question 2, 13.2.2 Part 1 of 4 HW Score: 0%, 0 of 7 points O Points: 0 of 1 Fitting a straight line to a set of data yields the prediction line 7; = 1 +6x, The values of X used to find the prediction line range from 1 to 32 a. Should this model be used to predict the mean value of Y when X equals 2? b. Should this model be used to predict the mean value of Y when X equals - 2? c. Should this model be used to predict the mean value of Y when X equals 0? d. Should this model be used to predict the mean value of Y when X equals 31? a. Should this model be used to predict the mean value of Y when X equals 2? Yes No Not enough information Homework: Ch 8.1 Simple Regression Question 3, 13.2.4 HW Score: 0%, 0 of 7 points Part 1 of 4 Points: 0 of 1 Save The production of wine is a mutbalion-dollar worldwide Industry in an attempt to develop a model of wine quality as judged by wine experts, data was collected from red wine variants of a certain type of wine. A sample of 12 wines is given Develop a simple linear regression model to predict wine quality measured on a scale from overy bad) to 10 (excellent), based on cohol content (5) Complete parts (a) through (d) bolow Click the icon to view the data of wine quality and cohol content a. Construct a scatter plot Choose the correct graphi below OB OG 00 104 o 35 AN o 10 Accord AN Alicho Homework: Ch 8.1 Simple Regression Question 4, 13.2.6-T Part 1 of 5 HW Score: 0% 0 of 7 points Points: 0 of 2 Save is A magazine publishes restaurant ratings for various locations sound the world. The magazine rates the restaurants for food, decor service, and the cool per person. Develop a regression model do predict the cost per person, based on a variable that represents the sum of the three ratings. The magazine has compiled the accompanying table of this summated ratings variable and the cost per person for 25 restaurants in a major city Complete parts (a) through (o) bolow Dm Click the con to view the table of summated ratings and cost per person a. Construct a scatter plot. Choose the correct graph below. AD 30 OB 4 Colt 007 OC AC 90 OD ACO SO Rating = Homework: Ch 8.1 Simple Regression Question 5, 13.2.9-7 HW Score: 0%, 0 of 7 points Save Pa 1017 Points: 0 of 2 is an agent for a readertad real estate company in a subuit located outuido a major city has the business objective of developing more accurato estimates of the monthly rental cost for apartment Toward the goal, the agent would like to use the size of an apartments fred by square footage to predict the monthly rental cost. The agent selects a sample of one bedroom apartments and the data are shown Complete parts through ) Monthly Rent (5) 075 1000000 1500 1.950 950 1625 1.250 Size Square Feet) 900 1,300 950 1.100 2.000 750 1,300 1,050 Construct a cathok plot. Choose the correct graph below) OB . OD AR 2000 3.000 2.000 oo 200 2.000 3000 2000 2.000