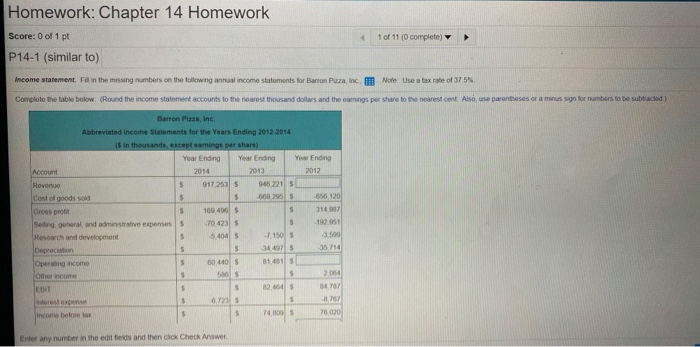
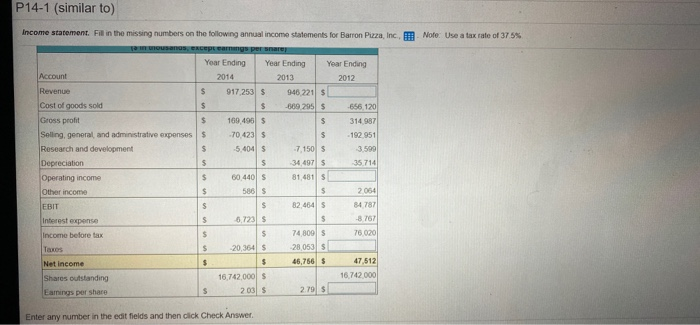
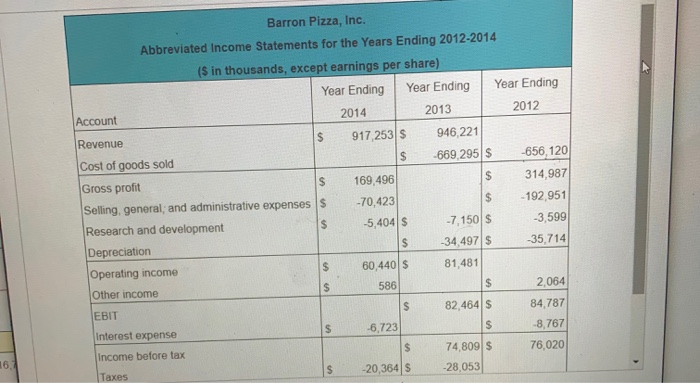
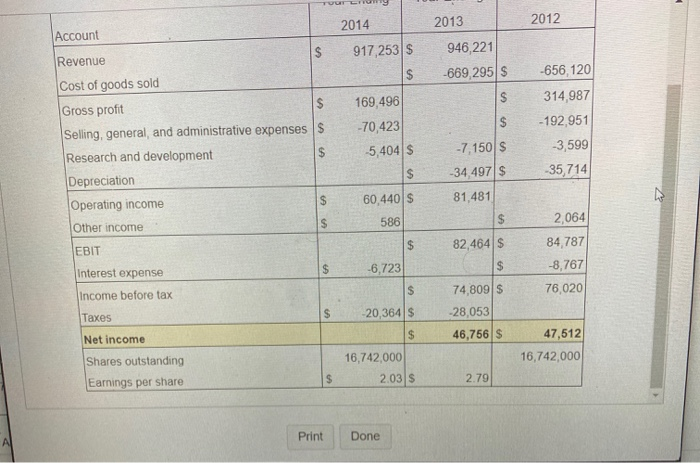
Homework: Chapter 14 Homework Score: 0 of 1 pt P14-1 (similar to) 1 of 11 (0 complete) Income statement. Fill in the missing numbers on the following annual income statements for Barson Puza, Inc. Note: Use a tax rate of 37.5% Complete the table below. (Round the income statement accounts to the nearest thousand dollars and the earnings per Share to the nearest cent. Also, use parentheses or a minus sign for numbers to be subtracted) Barron Pizza, Inc. Abbreviated Income Statements for the Years Ending 2012-2014 is in thousands, except earnings per share Year Ending Year Ending Year Ending 2014 2013 2012 Revenue $ 9172533 065 221 5 Cost of goods sold $ 600 795S larons prom 169 4065 314 Seding general, and administrative expenses 704231 192 051 Research and development 150 S -3.500 35714 Depreciation Operating income worst expense Income before Enter any number in the edit fields and then click Check Answer P14-1 (similar to) Income statement in the missing numbers on the following annual income statements for Barron Puzza, Inc. Note the state of 375 Account Revenue Cost of goods sold Gross profit Selling general, and administrative expenses Research and development Depreciation Operating income Other income Year Ending Year Ending Year Ending 2014 2013 2012 917 253 $ 946 221 $ $ 689 295 $ -656 120 109,496 5 314 987 704235 .192951 56045 7 150 s 3509 34.497s 35 714 00.440 81.481 S 82.464 5 Interest expense Income before tax 74 8095 28.053 20.3645 46.7565 47 512 Net income 16 72 000 Shares outstanding Eaming per she 16.742 000 $ 203 $ 2795 Enter any number in the edit fields and then click Check Answer Barron Pizza, Inc. Abbreviated Income Statements for the Years Ending 2012-2014 ($ in thousands, except earnings per share) Year Ending Year Ending Year Ending Account 2014 2013 2012 Revenue $ 917,253 $ 946,221 Cost of goods sold -669,295 $ -656,120 Gross profit 169,496 314,987 Selling, general; and administrative expenses $ -70,423 - 192,951 Research and development -5,404 $ -7,150 $ -3,599 Depreciation -34,497 $ -35,714 Operating income 60,440 $ 81,481 Other income 586 2,064 EBIT 82,464 84,787 Interest expense -6,723 -8,767 Income before tax 74,809 S 76,020 -20,364S -28,053 Taxes Account 2012 2013 946, 221 -669,295 $ Revenue Cost of goods sold Gross profit Selling, general and administrative expenses Research and development Depreciation Operating income Other income EBIT 2014 917,253 $ $ 169,496 -70,423 5,404 $ $ 60,440 S -656,120 314,987 -192,951 -3,599 35714 $ -7,150 $ -34.497 $ 81,481 586 82,464 S Interest expense -6,723 2,064 84,787 -8.767 76,020 Income before tax Taxes 20,364 $ 74,809 $ -28,053 46,756 s Net income Shares outstanding Earnings per share 16,742,000 . 2.035 47,512 16,742,000 2.79 Print Done