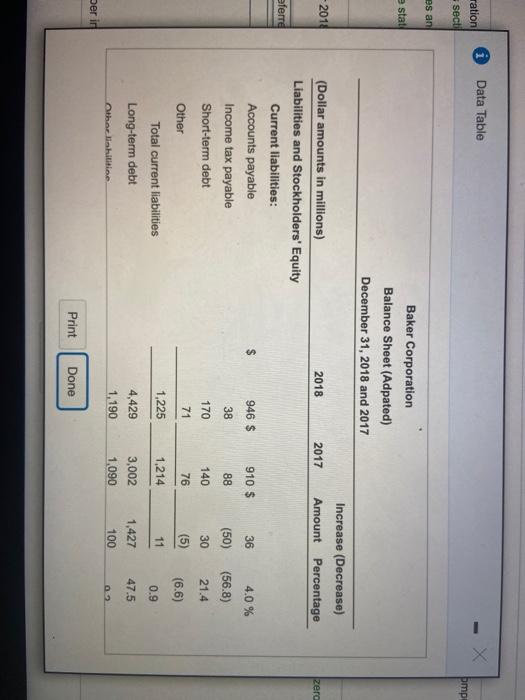
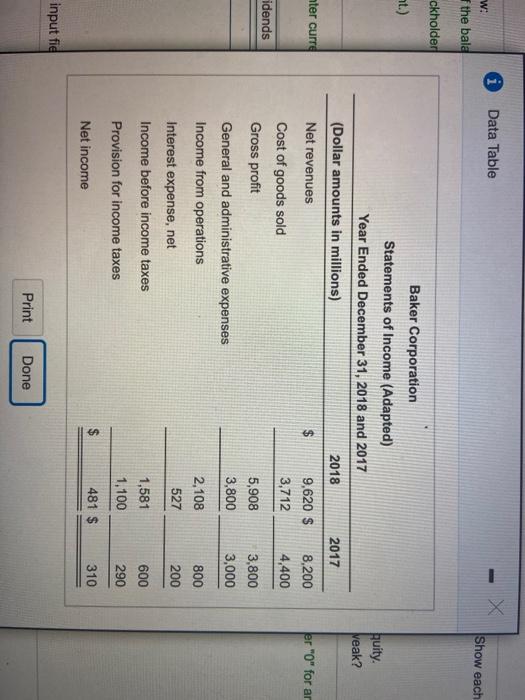
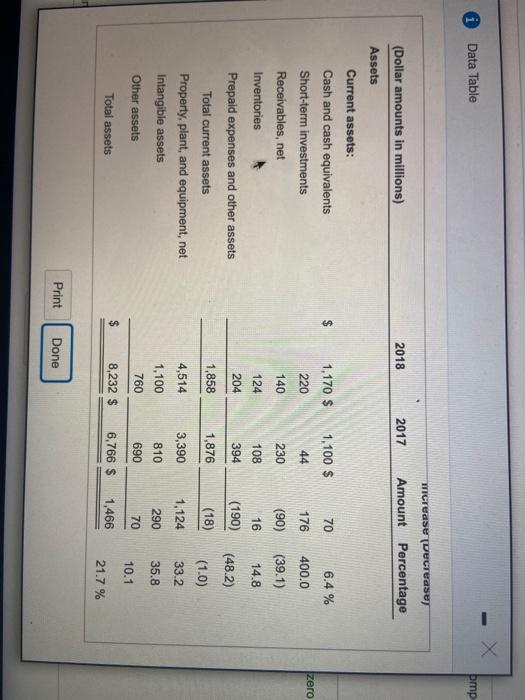
Homework: HW #11 (Financial Statement Analysis) G Bore: 0 of 1 pt 7 of 109 completo HW Score: 59.29.8.93 of 10 12-9 (similar to) The financial statements of Baker Corporation follow mick the icon to view the asta nodion of the balance sheet) (Click the icon to view the land ockhole equity sections of the balance sheet) (Click the icon to view the income statement) Calculate these profitability measures for 2018 Show each computation Rate of return on sale . Asetturnover ratio c. Rate of return on total d. Leverage (equity multiplier ratio .. Rate of return on common stockholders'aquity 1. Baker's profitability strong, medium, or weak? a. Compute the rate of return on sales for 2018. Enter currency amounts in milions as given in the weston Ignore interest expense in your analysis and enter for any rero balances Pound your answer to the ettenth of a percent XX%) Net income Preferred dividends Not sales Rate of one O ) i Data Table br Baker Corportion Balance Sheets (Adapted) December 31, 2018 and 2017 Increase (Decrease) Amount Percentage 2018 2017 (Dollar amounts in millions) Assets Current assets: 1,170 $ 1,100 $ 70 6.4 % 220 44 176 400.0 140 230 (90) (39.1) Cash and cash equivalents Short-term investments Receivables, net Inventories Prepaid expenses and other assets Total current assets 108 16 14.8 124 204 394 (190) (48.2) 1,858 1,876 (18) (1.0) Property plant and equipment net 4.514 3.390 1.124 33.2 Print Done i Data Table ration X bmp secti BS an estat Baker Corporation Balance Sheet (Adpated) December 31, 2018 and 2017 - 2014 Increase (Decrease) Amount Percentage 2018 2017 zerd eferre (Dollar amounts in millions) Liabilities and Stockholders' Equity Current liabilities: Accounts payable Income tax payable Short-term debt 946 $ 910 $ 36 38 88 (50) 4.0 % (56.8) 21.4 170 140 30 Other 71 76 (5) (6.6) 1,225 1,214 11 0.9 Total current liabilities Long-term debt 4,429 47.5 3,002 1,090 1,427 100 Other shititiae 1.190 Der in Print Done Data Table - X W: f the bala Show each ckholder ht.) Auity. Veak? 2017 ter curre er "O" for ar 8,200 4,400 idends Baker Corporation Statements of Income (Adapted) Year Ended December 31, 2018 and 2017 (Dollar amounts in millions) 2018 Net revenues 9,620 $ Cost of goods sold 3,712 Gross profit 5,908 General and administrative expenses 3,800 Income from operations 2,108 527 Interest expense, net Income before income taxes 1,581 Provision for income taxes 1,100 $ 481 $ Net income 3,800 3,000 800 200 600 290 310 input fic Print Done X i Data Table pmpu oration Es secti ties an 38 88 Income tax payable Short-term debt ne stall (56.8) 21.4 140 (50) 30 (5) 170 71 76 (6.6) 1,225 1,214 11 0.9 or 2014 47.5 zero 4,429 1,190 3,002 1,090 1,427 100 9.2 Prefer 6,844 5,306 1,538 29.0 Other Total current liabilities Long-term debt Other liabilities Total liabilities Stockholders' equity: Common stock Retained earnings Accumulated other comprehensive (loss) Total stockholders' equity Total liabilities and stockholders' equity 2 2 1,506 (120) 1,608 (150) (102) 30 (6.3) 20.0 1,388 1,460 (72) (4.9) 8,232 $ 6,766 $ 1,466 21.7 % mber in Print Done Data Table bmp Tricrease (Ducrease (Dollar amounts in millions) 2018 2017 Amount Percentage Assets $ 1,170 $ 1,100 $ 70 6.4 % zero 44 220 176 400.0 Current assets: Cash and cash equivalents Short-term investments Receivables, net Inventories Prepaid expenses and other assets 140 230 (90) (39.1) 124 108 16 14.8 204 394 (190) (18) (48.2) Total current assets 1,858 1,876 (1.0) 4,514 3,390 1,124 33.2 Property, plant, and equipment, net Intangible assets Other assets 1,100 810 290 35.8 760 690 70 10.1 Total assets $ 8,232 $ 6,766 $ 1,466 21.7 % Print Done


