

Answered step by step
Verified Expert Solution
Question
1 Approved Answer
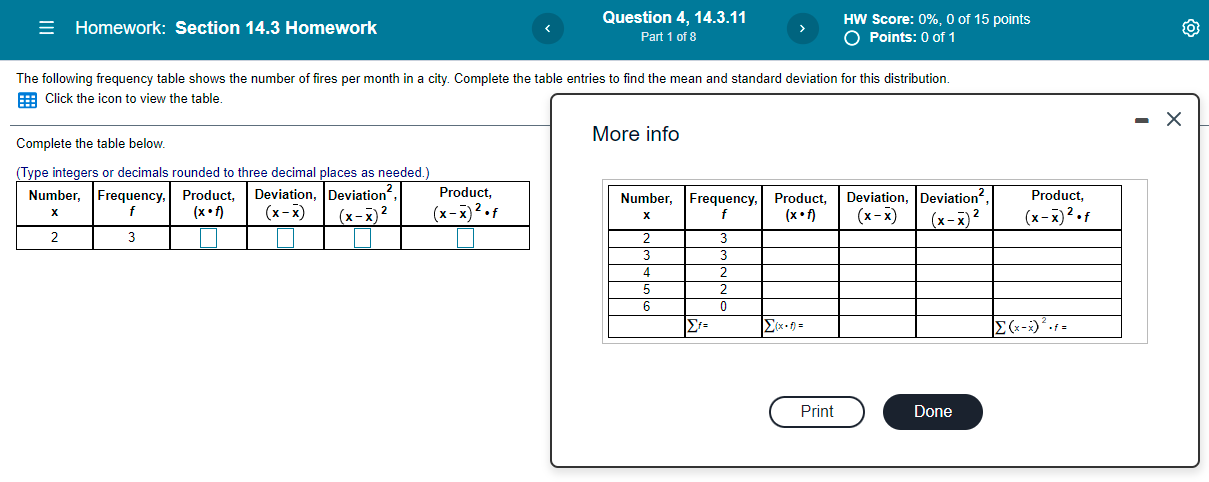
Homework: Section 14.3 Homework Question 4, 14.3.11 HW Score: 0%, 0 of 15 points Part 1 of 8 O Points: 0 of 1 The following

Step by Step Solution
There are 3 Steps involved in it
Step: 1

Get Instant Access to Expert-Tailored Solutions
See step-by-step solutions with expert insights and AI powered tools for academic success
Step: 2

Step: 3
Ace Your Homework with AI
Get the answers you need in no time with our AI-driven, step-by-step assistance
Get Started
WebAssign For College Algebra And Calculus An Applied Approach
Authors: Ron Larson
2nd Edition
133776843X, 9781337768436