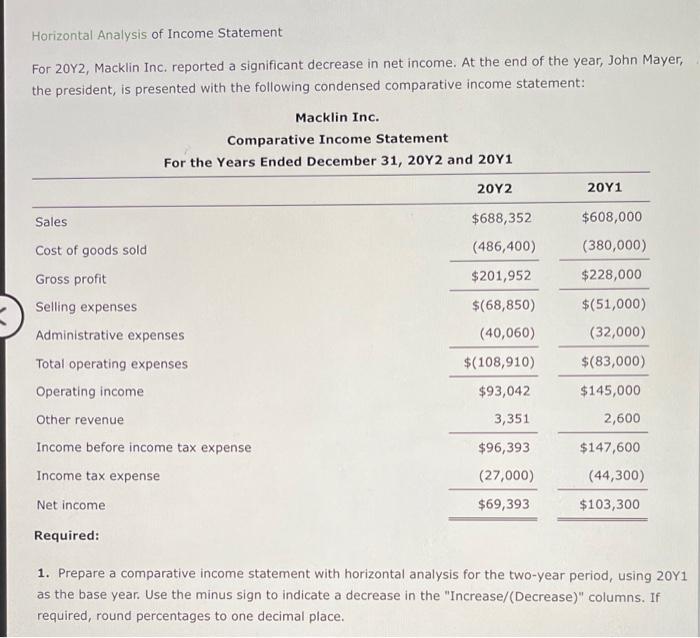
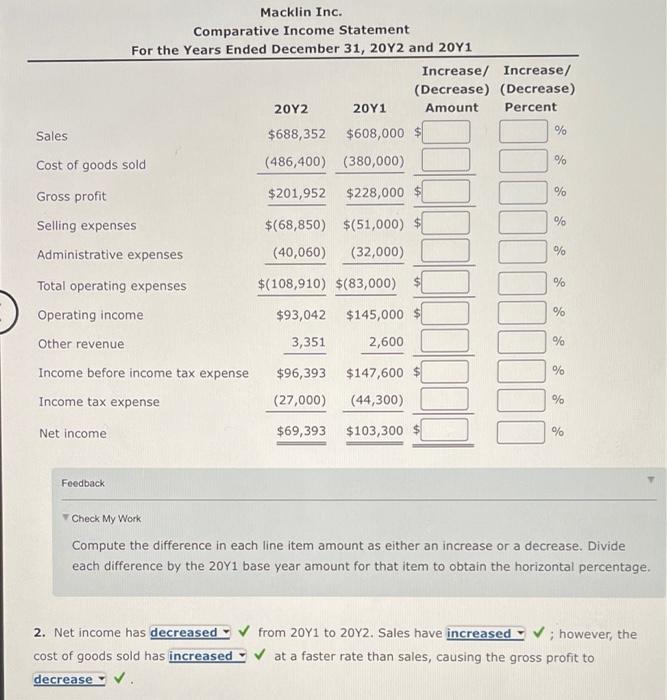
Horizontal Analysis of Income Statement For 2012, Macklin Inc. reported a significant decrease in net income. At the end of the year, John Mayer, the president, is presented with the following condensed comparative income statement: Macklin Inc. Comparative Income Statement For the Years Ended December 31, 2012 and 2041 20Y2 20Y1 Sales $688,352 $608,000 (486,400) (380,000) $ 201,952 $228,000 Cost of goods sold Gross profit Selling expenses Administrative expenses $(68,850) (40,060) $(108,910) $(51,000) (32,000) Total operating expenses $(83,000) $145,000 Operating income $93,042 Other revenue 3,351 2,600 Income before income tax expense Income tax expense Net income $96,393 (27,000) $69,393 $147,600 (44,300) $103,300 Required: 1. Prepare a comparative income statement with horizontal analysis for the two-year period, using 20Y1 as the base year. Use the minus sign to indicate a decrease in the "Increase/(Decrease)" columns. If required, round percentages to one decimal place. Macklin Inc. Comparative Income Statement For the Years Ended December 31, 20Y2 and 20Y1 Increase/ Increase/ (Decrease) (Decrease) 2012 20Y1 Amount Percent Sales $688,352 $608,000 % Cost of goods sold (486,400) (380,000) % $ 201,952 Gross profit % $228,000 $ Selling expenses % $(68,850) $(51,000) $ (40,060) (32,000) Administrative expenses % $(108,910) $(83,000) % $145,000 % Total operating expenses Operating income Other revenue Income before income tax expense Income tax expense $93,042 3,351 2,600 % $96,393 $147,600 $ % (27,000) (44,300) % Net income $69,393 $ 103,300 $ % Feedback Check My Work Compute the difference in each line item amount as either an increase or a decrease. Divide each difference by the 20Y1 base year amount for that item to obtain the horizontal percentage. 2. Net income has decreased from 20Y1 to 2012. Sales have increased; however, the cost of goods sold has increased at a faster rate than sales, causing the gross profit to decrease