horizontal and verical analysis of tc energy company and enbridge comapany year 2019 and 2020
i only need vertical and horizontal analysis of these companies.
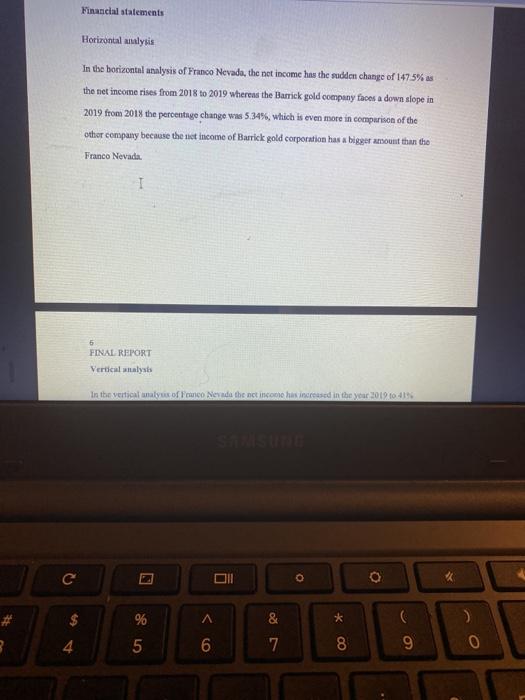
like this but these are different comapany
this is of tc energy company
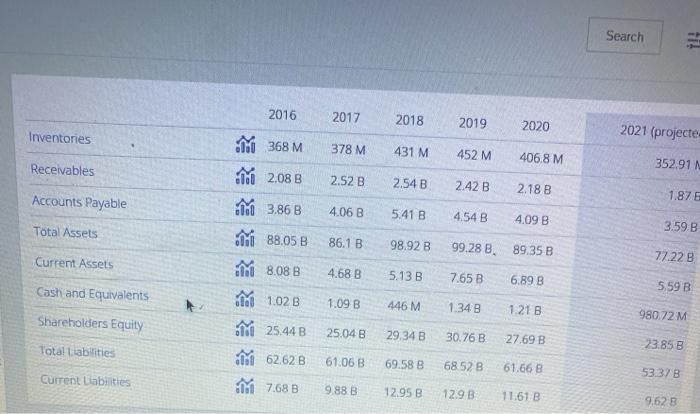
Financial statements Horizontal analysis In the horizontal analysis of Franco Nevada, the net income has the sudden change of 147.5% as the net income rises from 2018 to 2019 whereas the Barrick gold company faces a down slope in 2019 from 2018 the percentage change was 5.34%, which is even more in comparison of the other company beenuse the net income of Barrick gold corporation has a bigger annount than the Franco Nevada 1 FINAL REPORT Vertical walysis In the vertical analyx ofco Nevada the net inchis increased in the year 2019 41% c 011 o $ % & * ) 0 5 6 7 8 9 Search TI: 2016 2017 2018 2019 2020 2021 (projecte Inventories 378 M 431 M 452M 406.8 M Receivables 352.91 N 2.52B 2.54 B 2.42 B 2.18 B Accounts Payable 1.87 4.06 B 5.41 B 454 B 4.09 B Total Assets 3.59 B 86.1 B 98.92 B 99.28 B. 89.35 B Current Assets 77.22B M 368 M 2.088 to 3.86 B M 88.05B M 8.08 B til 1.02B Mi 25,44 B Mi 62.62B Mi 7.68B 4.68 B 5.13B 7.65 B 6.898 Cash and Equivalents 5.59 B 1.09 B 446 M 1.34 B 1.21 B 980.72M Shareholders Equity 25.04 B 29.34 B 30.76 B 27.69 B Totaltabilities 23.85 B 61.06 B 69.58 B 68528 61.668 53378 Current Liabilities 9.88.B 12.95 B 12.9 B 11.61 B 9.62 B Financial statements Horizontal analysis In the horizontal analysis of Franco Nevada, the net income has the sudden change of 147.5% as the net income rises from 2018 to 2019 whereas the Barrick gold company faces a down slope in 2019 from 2018 the percentage change was 5.34%, which is even more in comparison of the other company beenuse the net income of Barrick gold corporation has a bigger annount than the Franco Nevada 1 FINAL REPORT Vertical walysis In the vertical analyx ofco Nevada the net inchis increased in the year 2019 41% c 011 o $ % & * ) 0 5 6 7 8 9 Search TI: 2016 2017 2018 2019 2020 2021 (projecte Inventories 378 M 431 M 452M 406.8 M Receivables 352.91 N 2.52B 2.54 B 2.42 B 2.18 B Accounts Payable 1.87 4.06 B 5.41 B 454 B 4.09 B Total Assets 3.59 B 86.1 B 98.92 B 99.28 B. 89.35 B Current Assets 77.22B M 368 M 2.088 to 3.86 B M 88.05B M 8.08 B til 1.02B Mi 25,44 B Mi 62.62B Mi 7.68B 4.68 B 5.13B 7.65 B 6.898 Cash and Equivalents 5.59 B 1.09 B 446 M 1.34 B 1.21 B 980.72M Shareholders Equity 25.04 B 29.34 B 30.76 B 27.69 B Totaltabilities 23.85 B 61.06 B 69.58 B 68528 61.668 53378 Current Liabilities 9.88.B 12.95 B 12.9 B 11.61 B 9.62 B