

Answered step by step
Verified Expert Solution
Question
1 Approved Answer
Hour Cars and Trucks (HCT) offers hourly-rate car and truck rentals to customers in three cities: Phoenix, Austin, and NYC. HCT's head office controls all
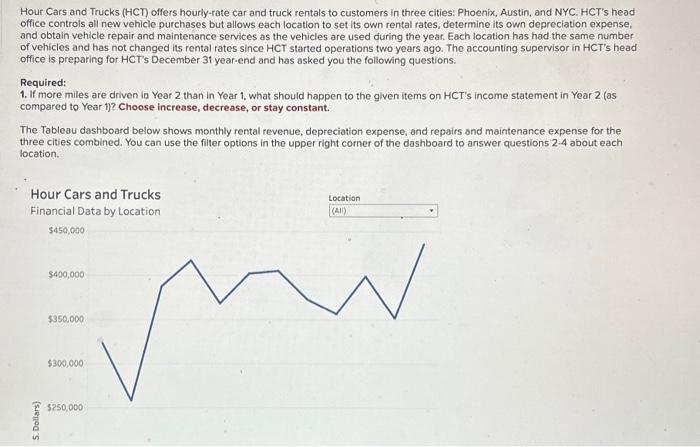
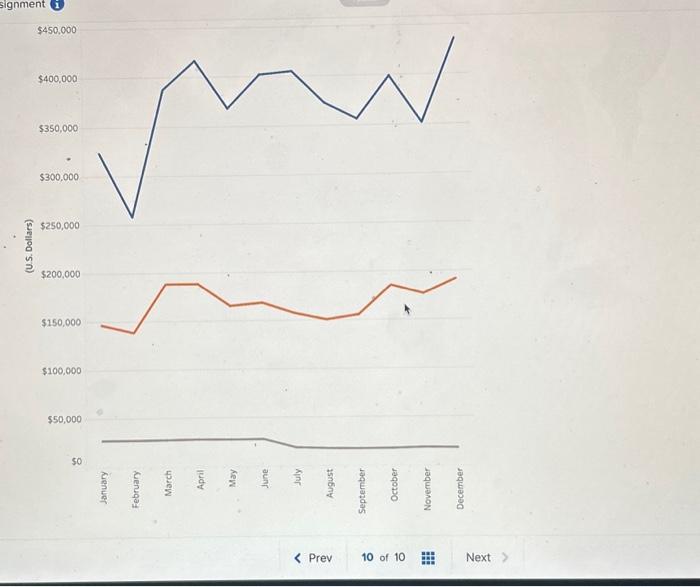

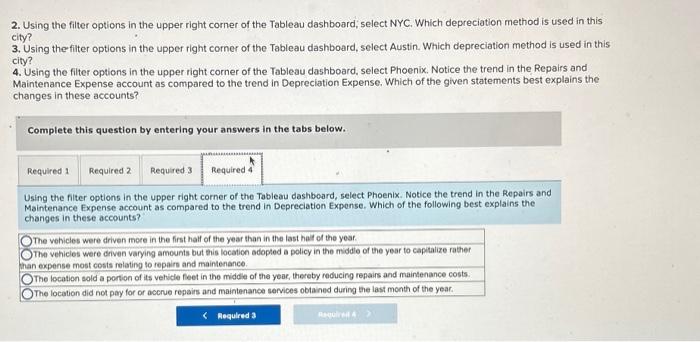 Hour Cars and Trucks (HCT) offers hourly-rate car and truck rentals to customers in three cities: Phoenix, Austin, and NYC. HCT's head office controls all new vehicle purchases but allows each location to set its own rental rates, determine its own depreciation expense, and obtain vehicle repair and maintenance services as the vehicles are used during the year. Each location has had the same number of vehicles and has not changed its rental rates since HCT started operations two years ago. The accounting supervisor in HCT's head office is preparing for HCTs December 31 year-end and has asked you the following questions. Required: 1. If more miles are driven in Year 2 than in Year 1, what should happen to the given items on HCT's income statement in Year 2 (as compared to Year 1 ? Choose increase, decrease, or stay constant. The Tableau dashboard below shows monthly rental revenue, depreciation expense, and repairs and maintenance expense for the three cities combined. You can use the filter options in the upper right corner of the dashboard to answer questions 24 about each location. $100,000 $50,000 50
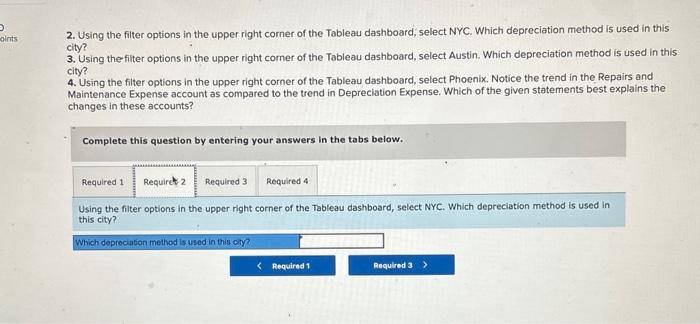
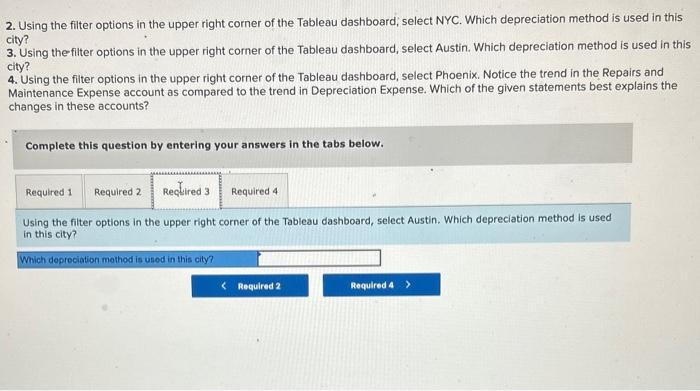
 2. Using the filter options in the upper right comer of the Tableau dashboard, select NYC. Which depreciation method is used in this city? 3. Using the filter options in the upper right comer of the Tableau dashboard, select Austin. Which depreciation method is used in this: 4. Using the fiter options in the upper right corner of the Tableau dashboard; select Phoenix Notice the trend in the Repairs and changes in these accounts? Complete this question by entering your answers in the tabs below. If more miles are driven in Year 2 than in Year 1 , whut shoudd happen to the following hems on HCT: income statement in Year 2 (as compered to Year 1) ? Choone incresse, btcrease, of stay constant. 2. Using the filter options in the upper right corner of the Tableau dashboard, select NYC. Which depreciation method is used in this 3. Using the filter options in the upper right comer of the Tableau dashboard, select Austin. Which depreciation method is used in this city? 4. Using the fitter options in the upper right corner of the Tableau dashboard, select Phoenix. Notice the trend in the Repairs and Maintenance Expense account as compared to the trend in Depreciation Expense. Which of the given statements best explains the changes in these accounts? Complete this question by entering your answers in the tabs below. Using the fiter options in the upper right corner of the Tableau dashboard, select NYC. Which depreciation method is used in this city? 2. Using the filter options in the upper right corner of the Tableau dashboard; select NYC. Which depreciation method is used in this city? 3. Using the filter options in the upper right corner of the Tableau dashboard, select Austin. Which depreciation method is used in this city? 4. Using the filter options in the upper right corner of the Tableau dashboard, select Phoenix. Notice the trend in the Repairs and Maintenance Expense account as compared to the trend in Depreciation Expense. Which of the given statements best explains the changes in these accounts? Complete this question by entering your answers in the tabs below. Using the filter options in the upper right corner of the Tableau dashboard, select Austin. Which depreciation method is used in this city? 2. Using the filter options in the upper right corner of the Tableau dashboard; select NYC. Which depreciation method is used in this city? 3. Using the filter options in the upper right corner of the Tableau dashboard, select Austin. Which depreciation method is used in this city? 4. Using the filter options in the upper right corner of the Tableau dashboard, select Phoenix. Notice the trend in the Repairs and Maintenance Expense account as compared to the trend in Depreciation Expense. Which of the given statements best explains the changes in these accounts? Complete this question by entering your answers in the tabs below. Using the fiter options in the upper right corner of the Tableau dashboard, select Phoenix. Notice the trend in the Repairs and Maintenance Expense account as compared to the trend in Depreciation Expense. Which of the following best explains the changes in these accounts? The vehicies were driven more in the first half of the year than in the last hal of the year. The vehicies were diven varying amounts but this location adopted a policy in the middle of the year to captalize rather man expense most costs relating to repairs and maintenance. The location sold a portion of its vehicle feet in the middle of the yeac, thereby reducing repairs and maintenance costs. The location did not pay for or occrue repairs and maintenance services obtained during the last month of the year
Step by Step Solution
There are 3 Steps involved in it
Step: 1

Get Instant Access to Expert-Tailored Solutions
See step-by-step solutions with expert insights and AI powered tools for academic success
Step: 2

Step: 3
Ace Your Homework with AI
Get the answers you need in no time with our AI-driven, step-by-step assistance
Get Started
Interne Revision In Verbundgruppen Und Franchise Systemen Verbreitung Und Qualit T Der Internen Revision In Unternehmensnetzwerken
Authors: Hans Ulrich Westhausen
1st. Aufl. 2016 Edition
3658121963, 978-3658121969