

Question
Housing Prices Going into the Real Estate Bubble The following table shows the average percentage increase in the price of a house in 9 regions
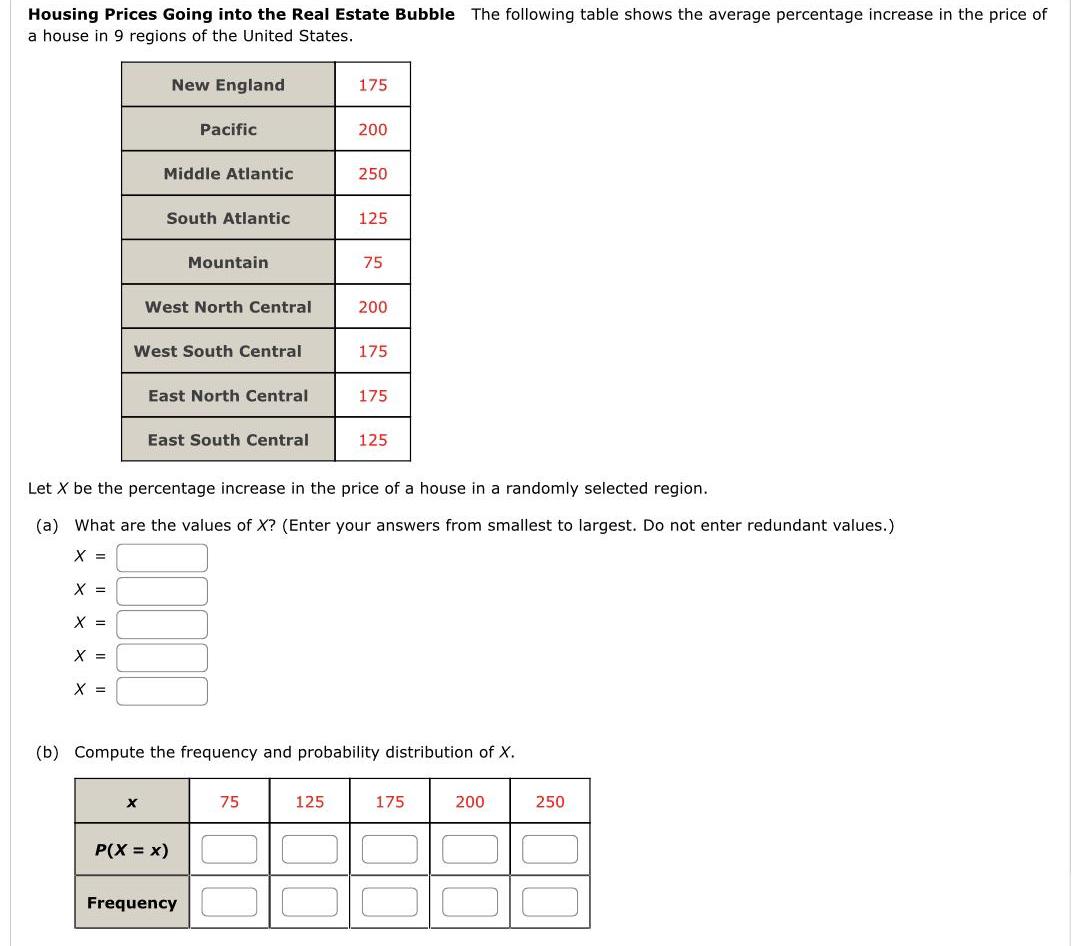

Housing Prices Going into the Real Estate Bubble The following table shows the average percentage increase in the price of a house in 9 regions of the United States X X X X New England Middle Atlantic X Pacific South Atlantic West North Central West South Central Mountain East North Central East South Central P X X Frequency 175 75 200 Let X be the percentage increase in the price of a house in a randomly selected region a What are the values of X Enter your answers from smallest to largest Do not enter redundant values X 125 250 125 75 200 b Compute the frequency and probability distribution of X 175 175 125 175 200 250
Step by Step Solution
There are 3 Steps involved in it
Step: 1

Get Instant Access to Expert-Tailored Solutions
See step-by-step solutions with expert insights and AI powered tools for academic success
Step: 2

Step: 3
Ace Your Homework with AI
Get the answers you need in no time with our AI-driven, step-by-step assistance
Get Started
Precalculus
Authors: Ron Larson, Scott T Meier
8th Edition
1111787379, 9781111787370