Question
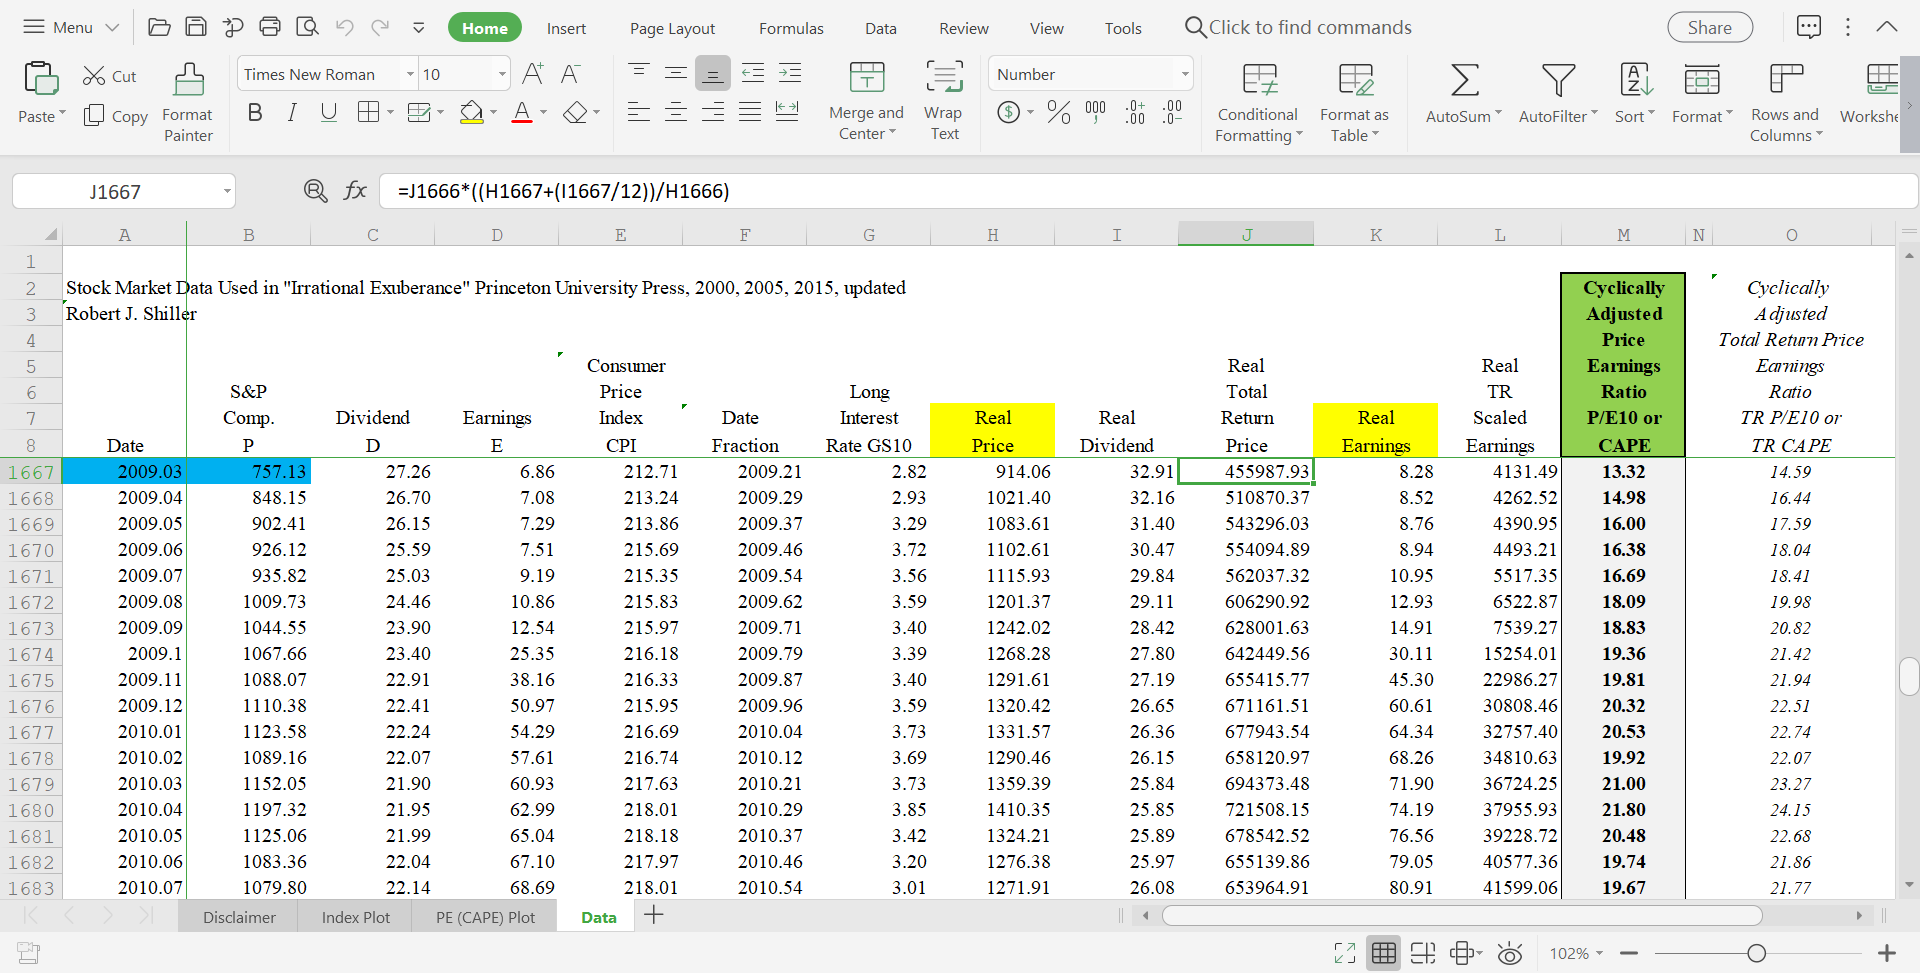
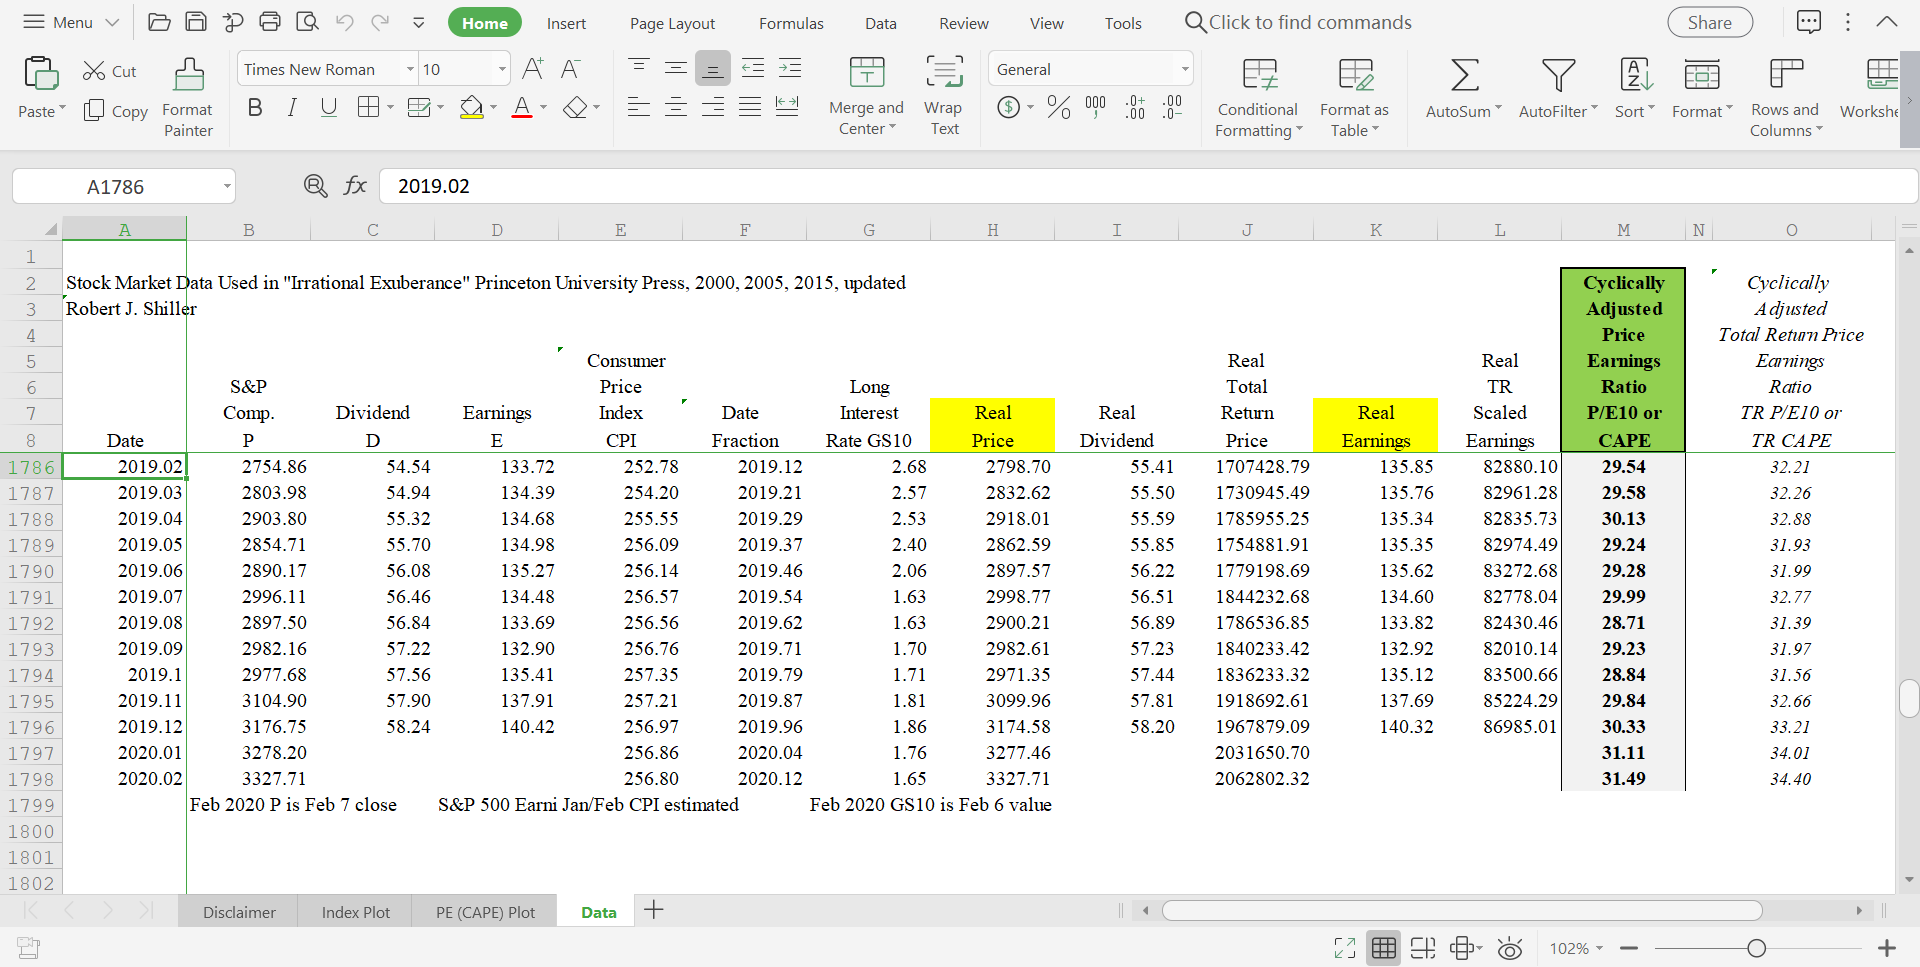
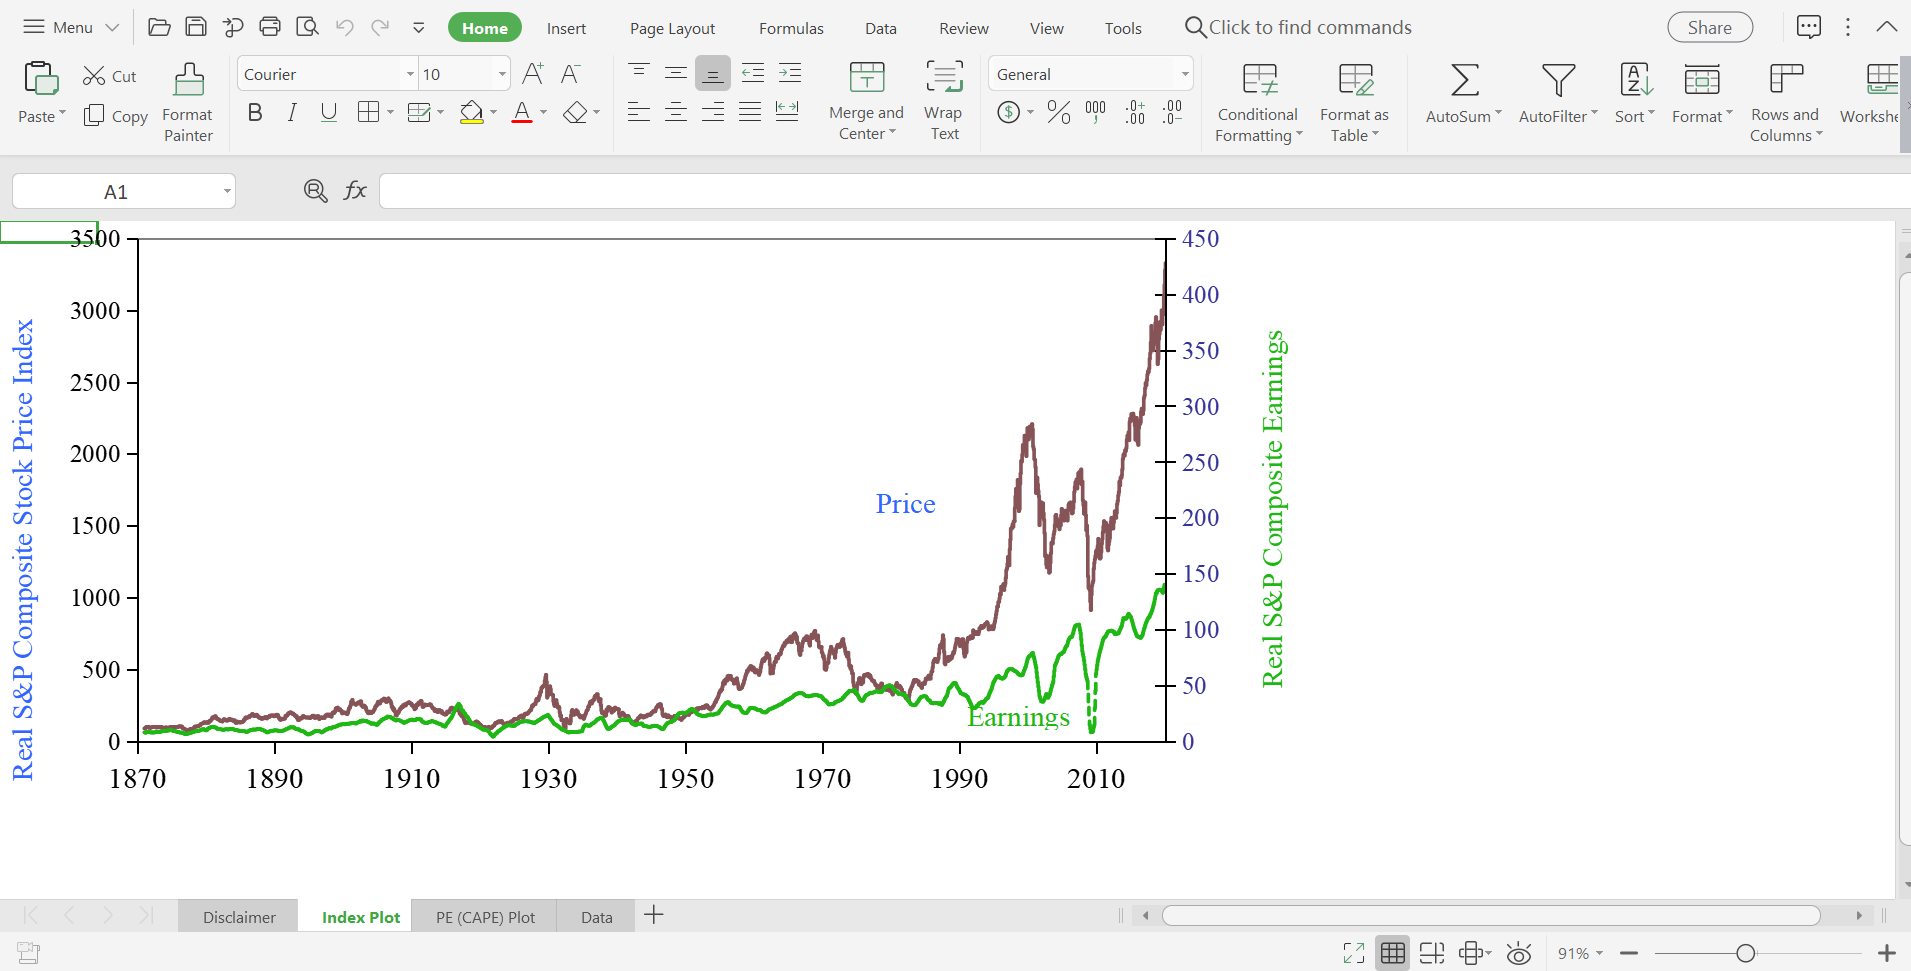
.How are the real S&P 500 index price and its real earnings calculated? Explain them using economic terms, based on done calculations in dataset 2.
.How are the real S&P 500 index price and its real earnings calculated? Explain them using economic terms, based on done calculations in dataset
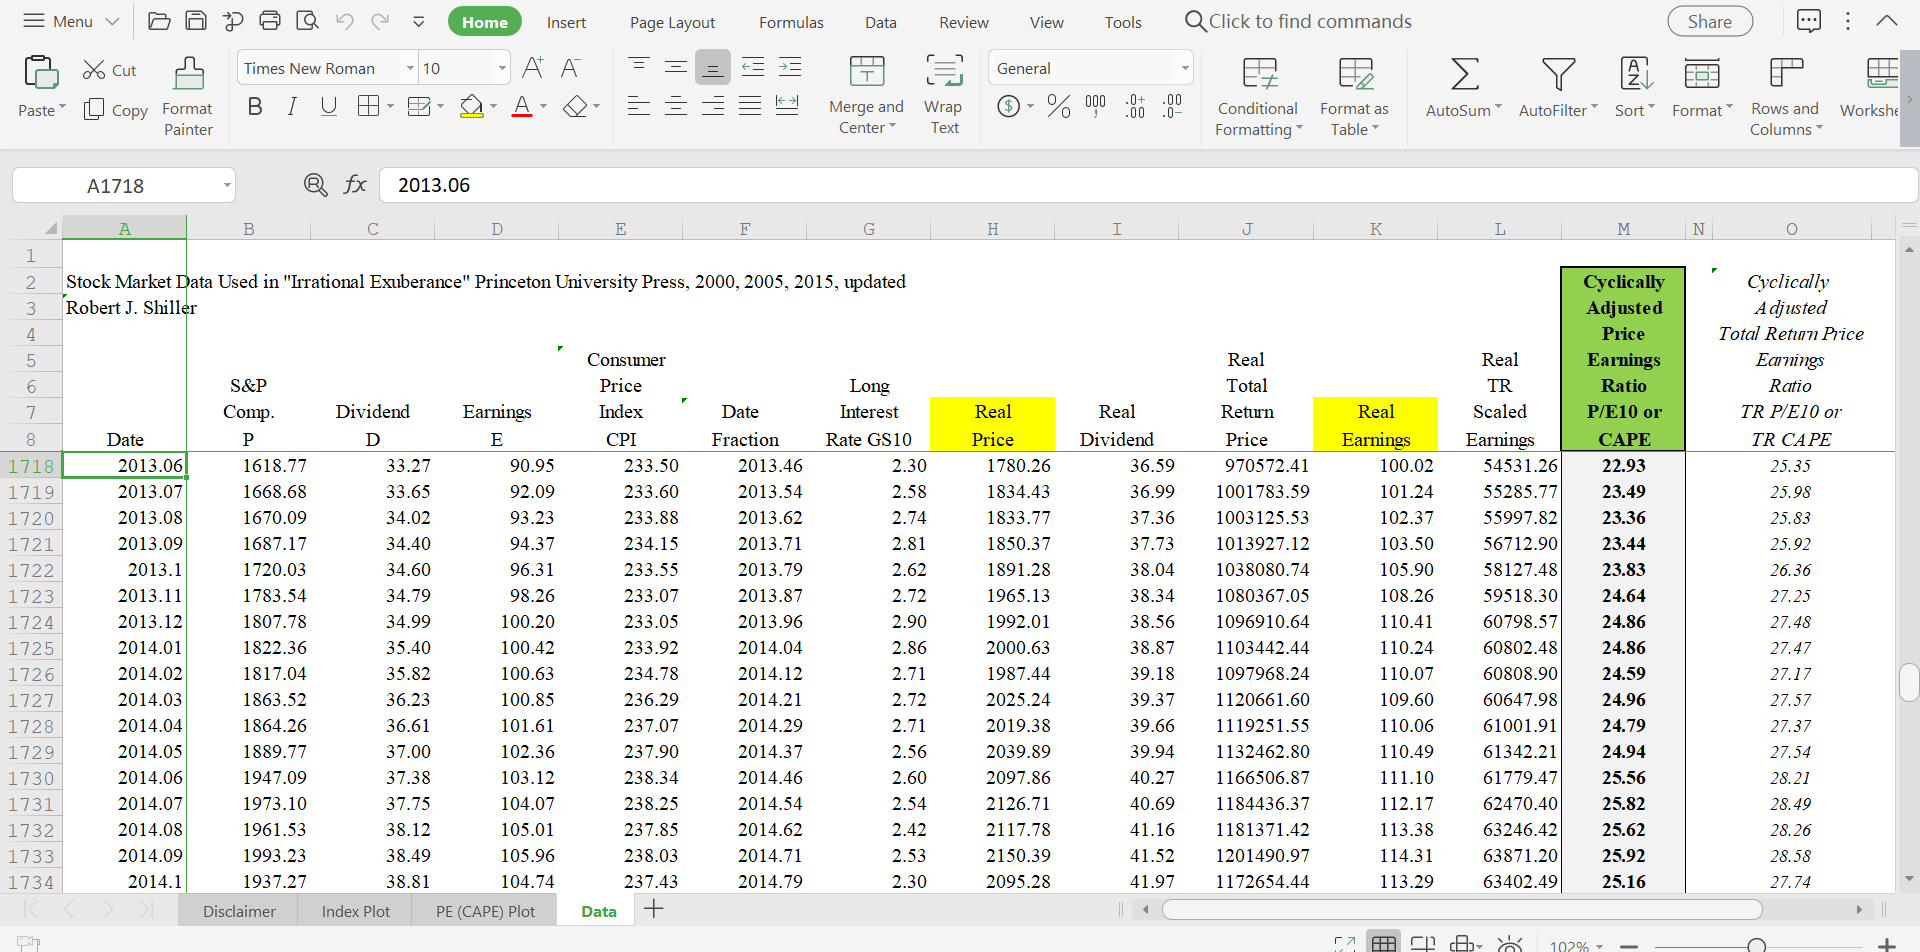
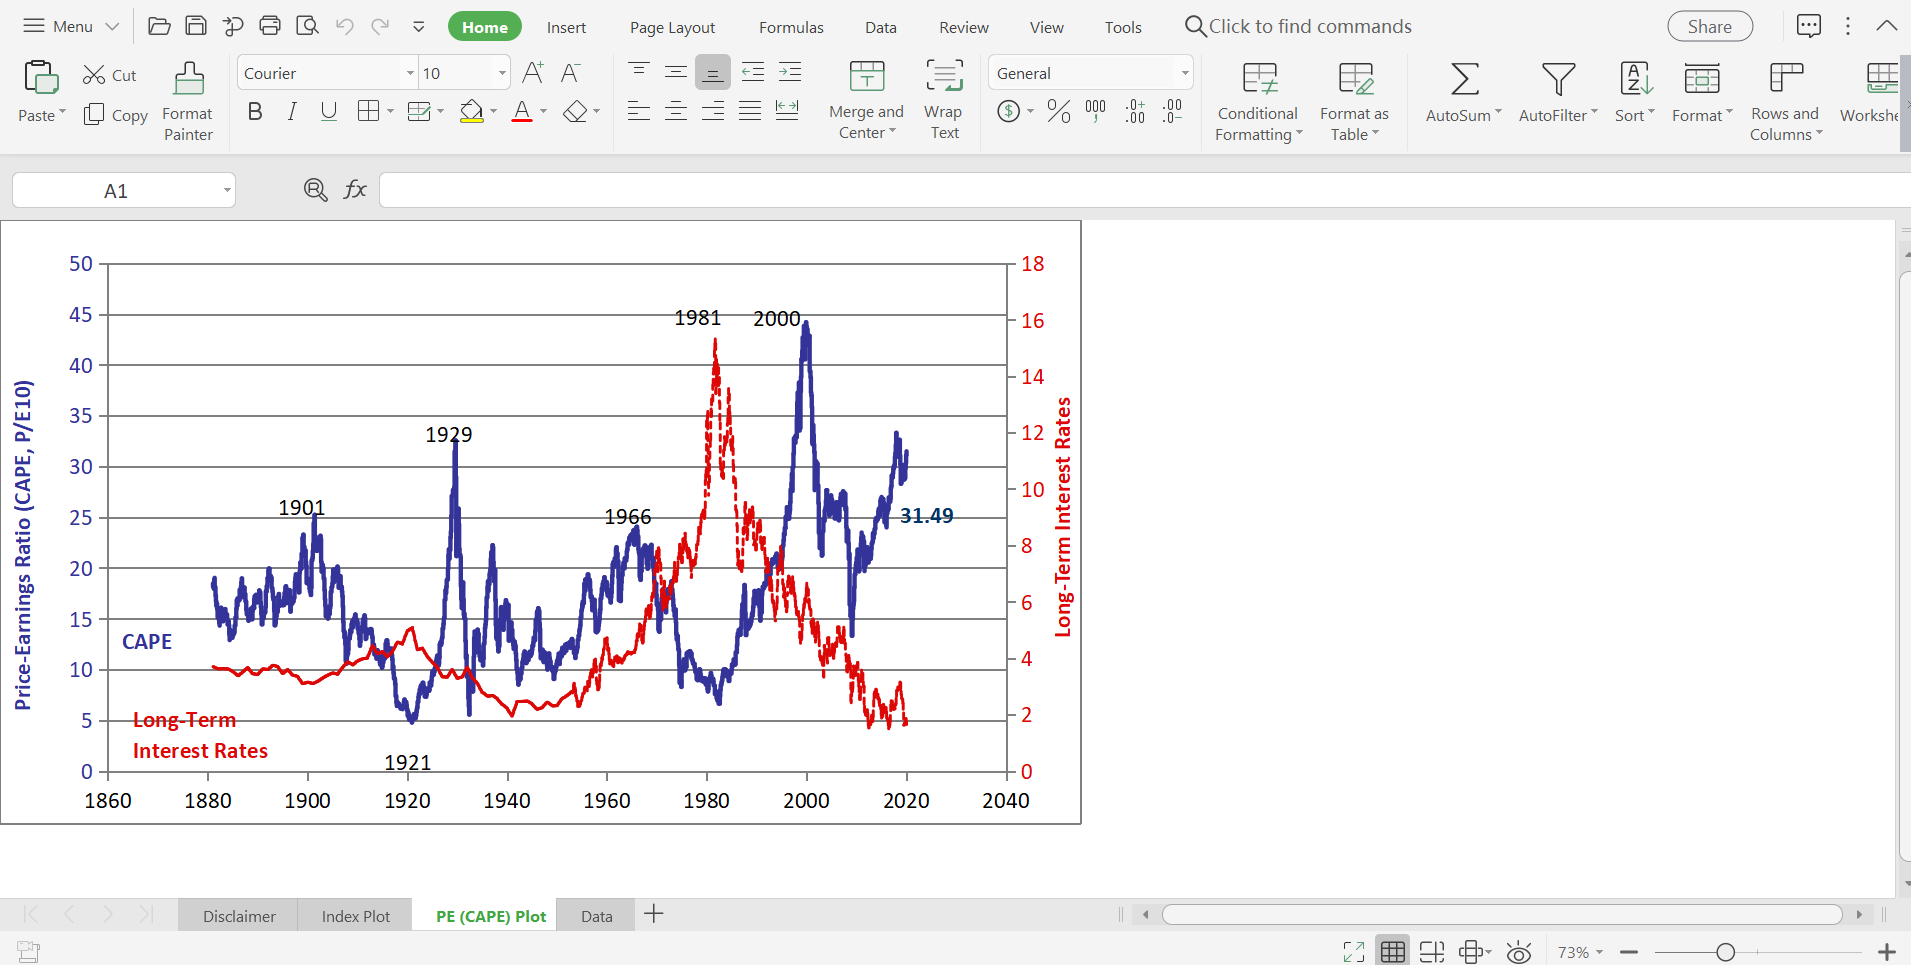
2. How is the CAPE calculated? Explain it using economic terms, based on done calculations in dataset
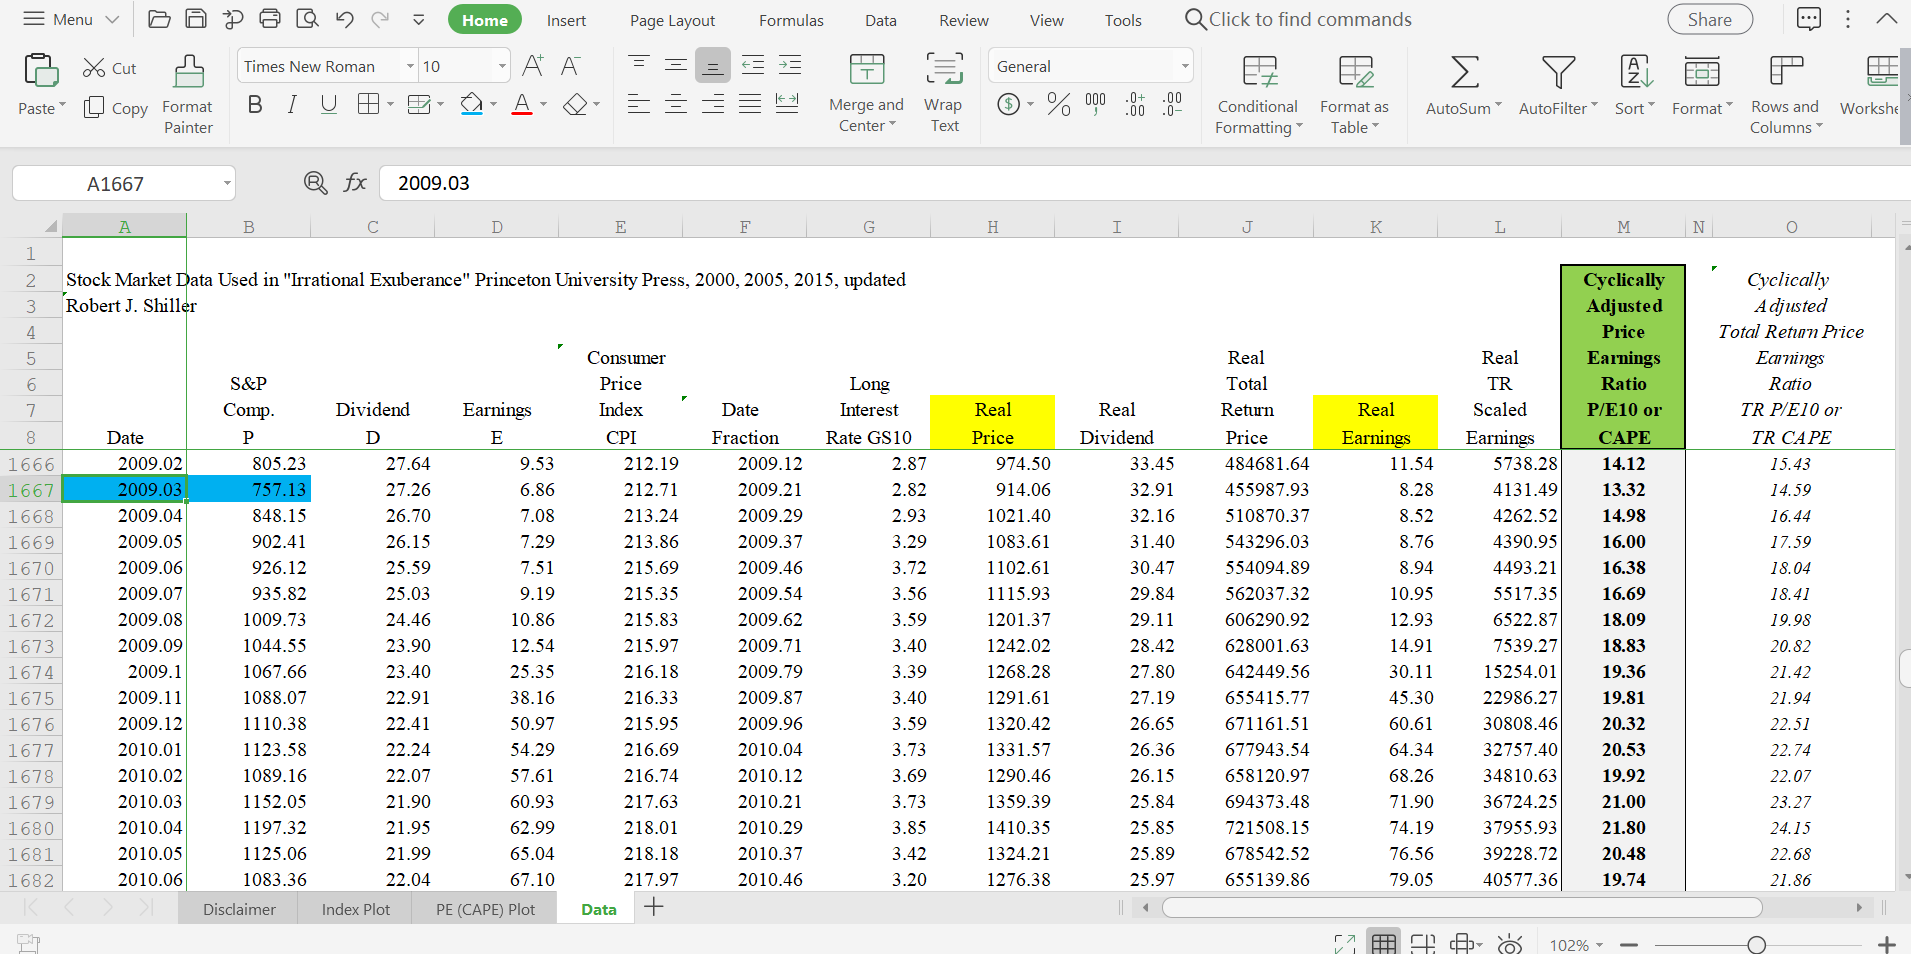
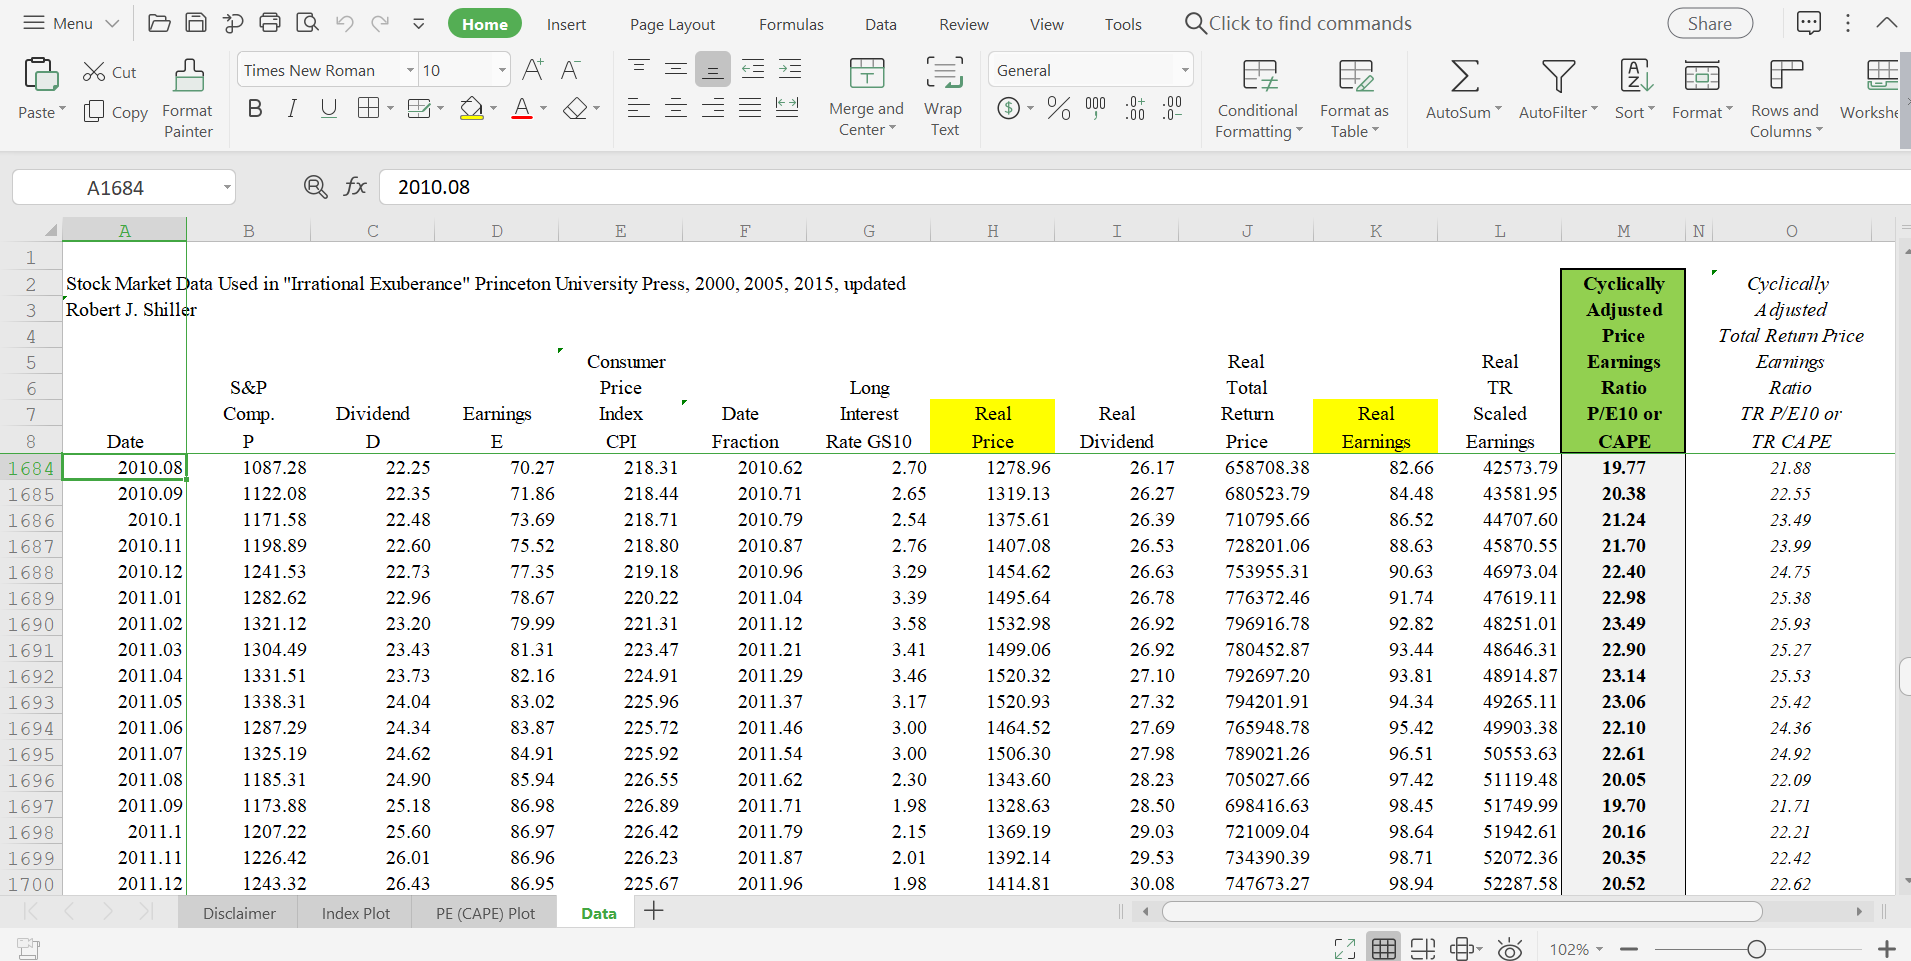
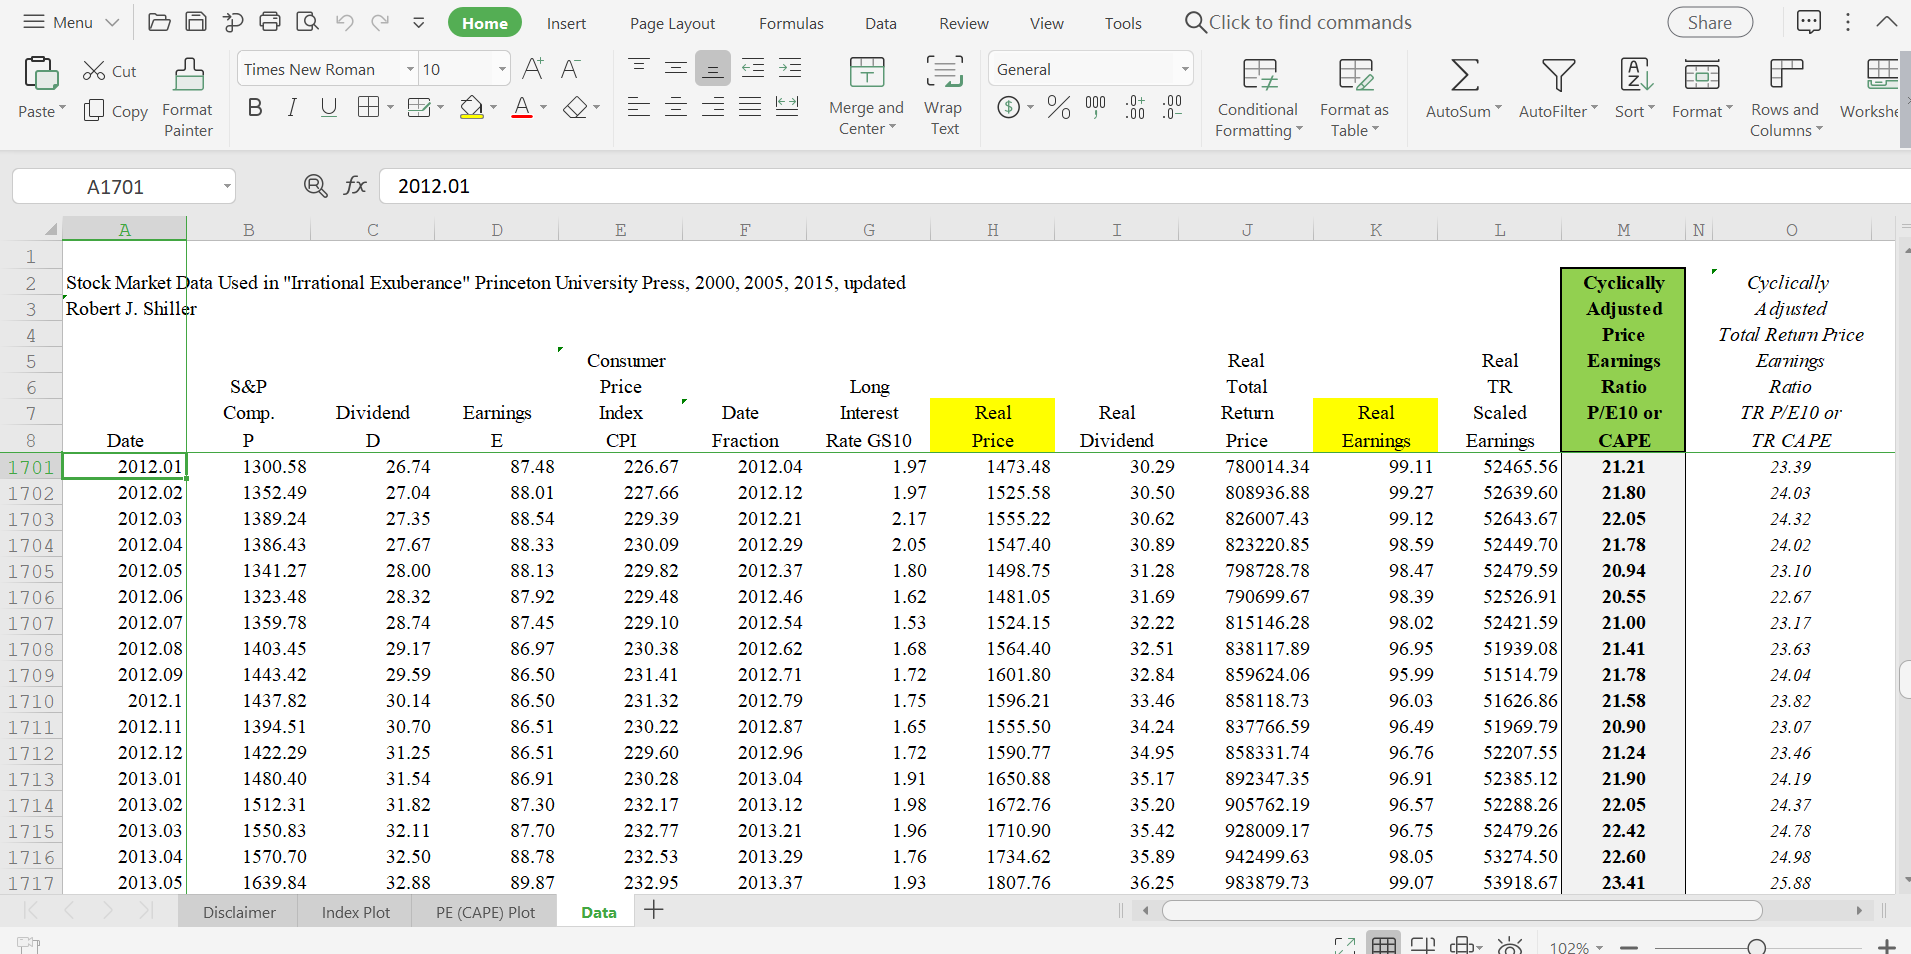
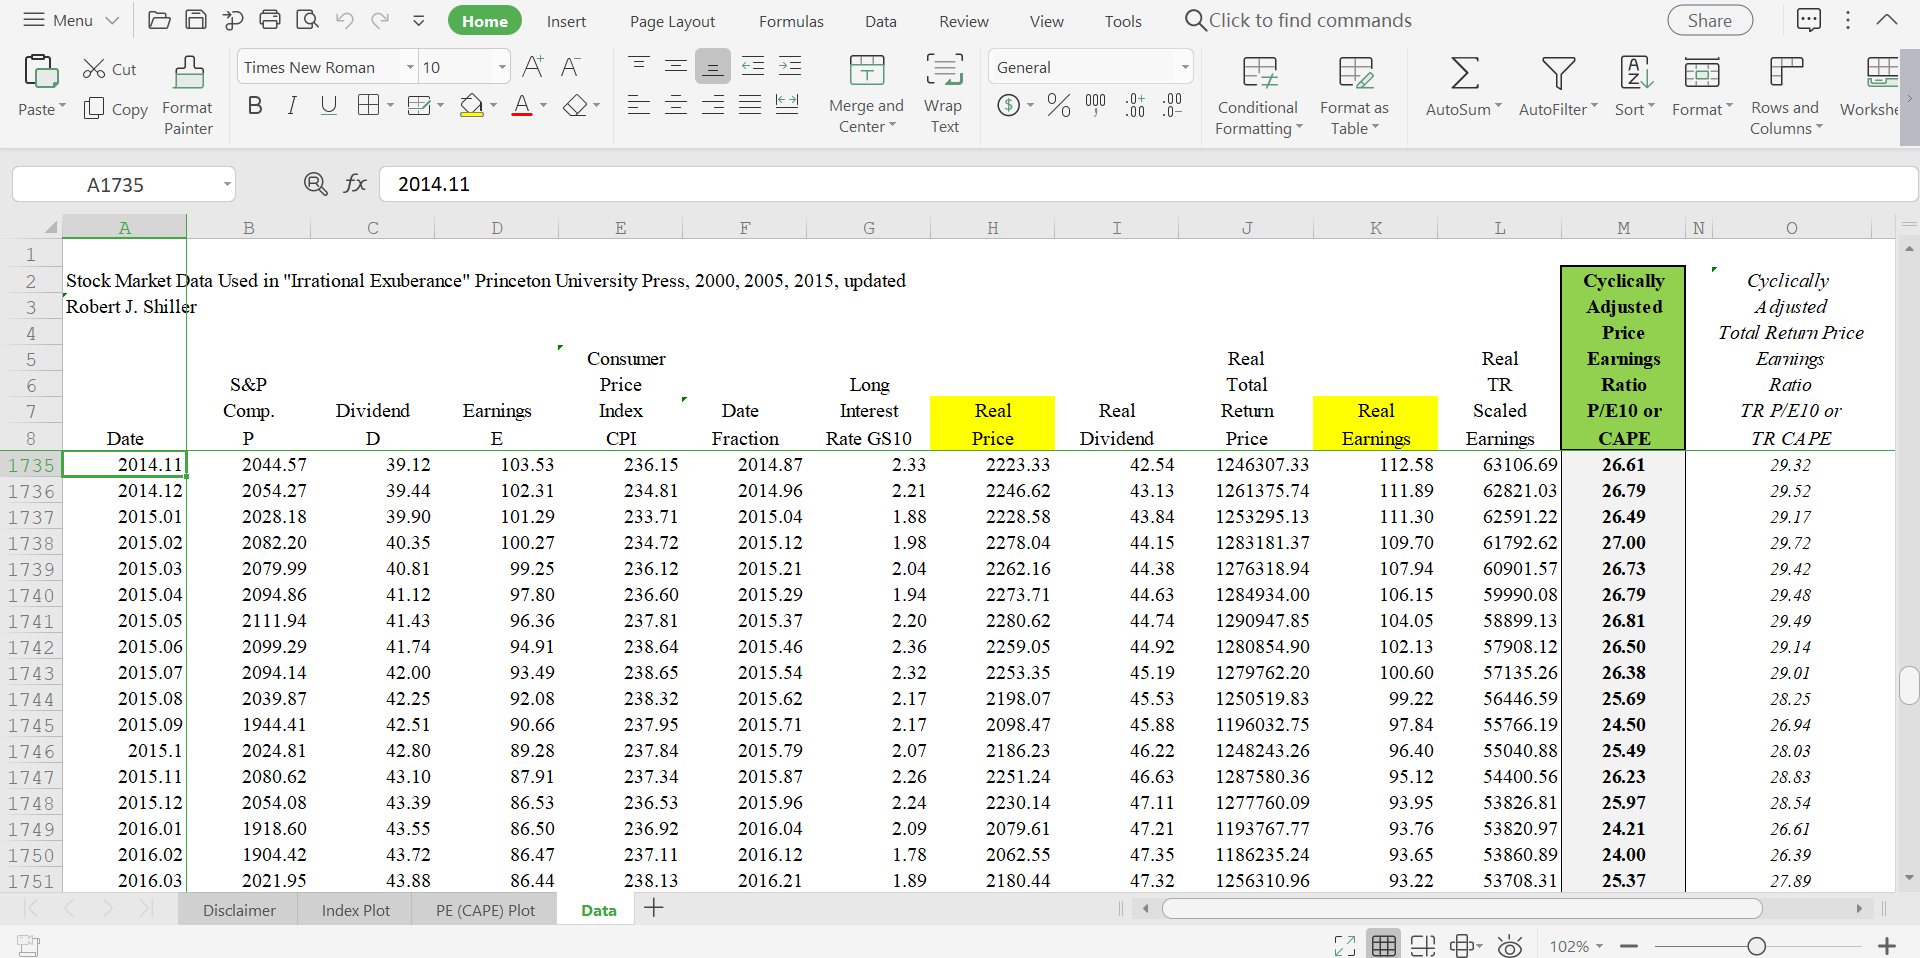
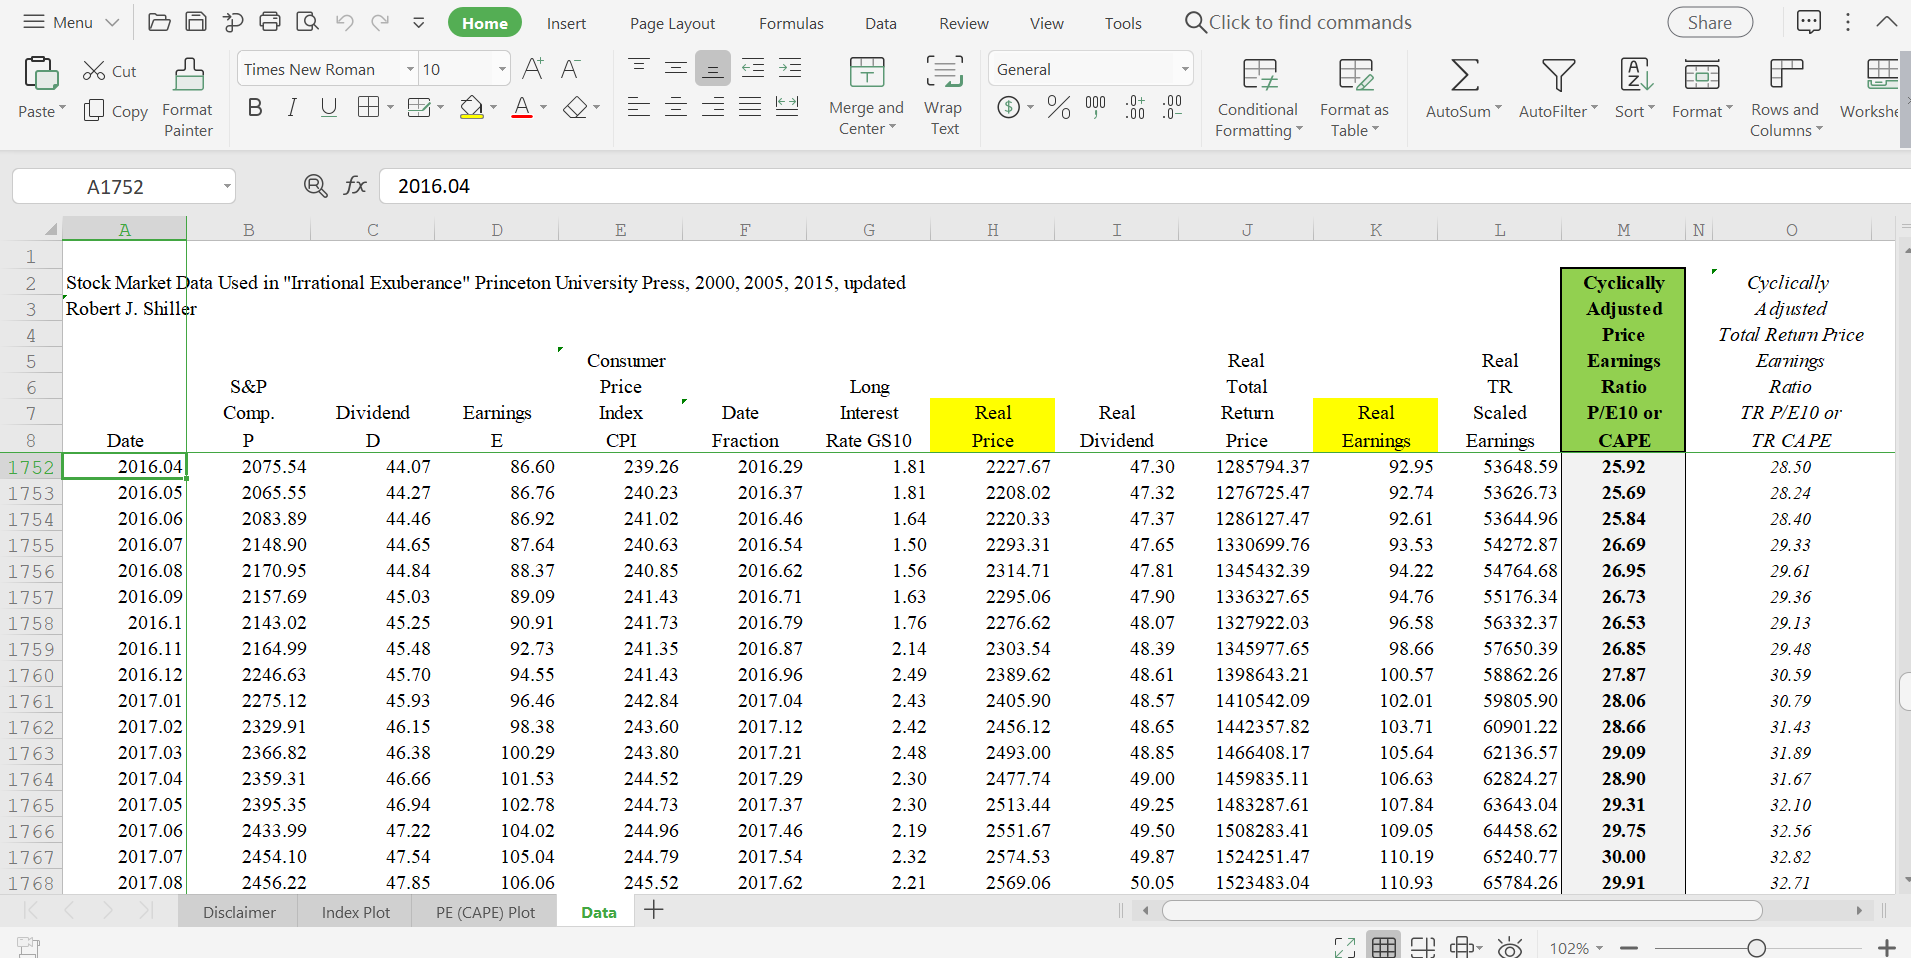
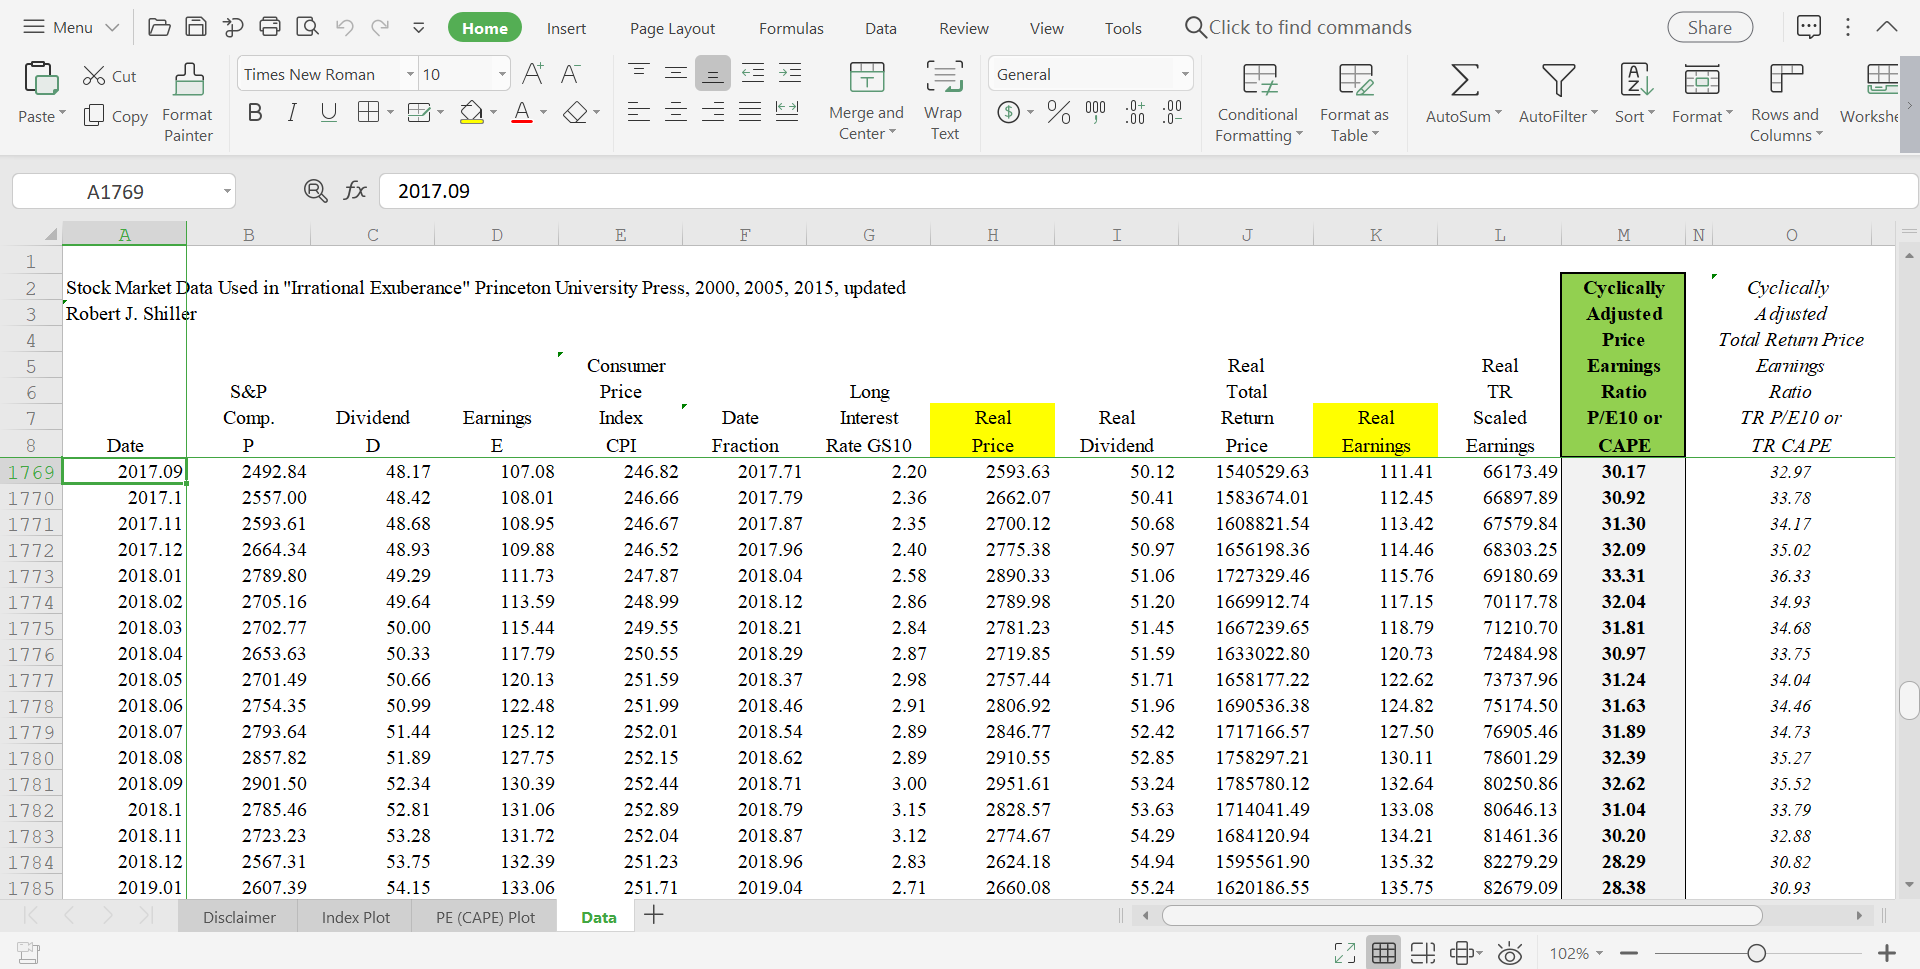
3. If you look at the S&P 500 index price, there was a local minimum of 757.13 in March 2009. What is the real rate of return on the capital gains of the S&P 500 from March 2009 to February 2020? What is the total real return of the S&P 500 from March 2009 to February 2020?
4.What are the percentage increases of the real earnings and real dividends of the S&P 500 from March 2009 to December 2019, the most recent month for which we have data?
5. What are the CAPE of the S&P 500 in March 2009 and in February 2020, respectively?
6.Do you think that the S&P 500 index price has increased too fast in the last ten years so that there might be a bubble now?
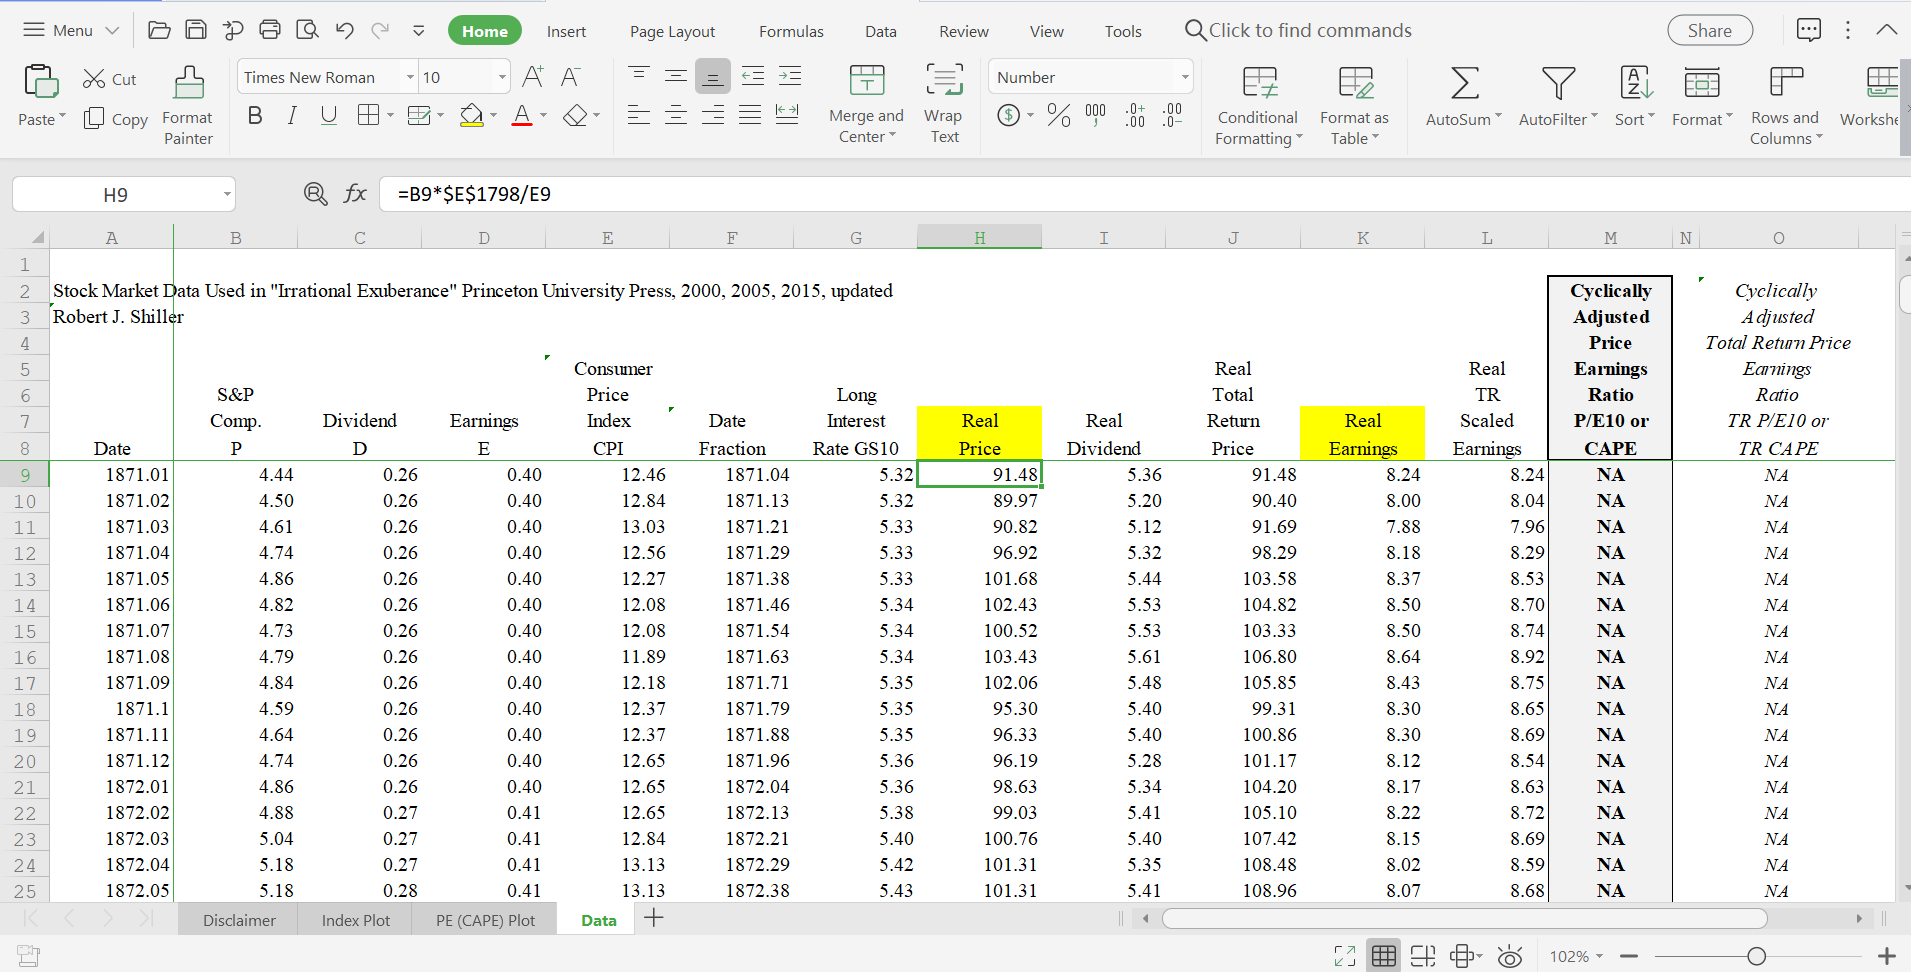
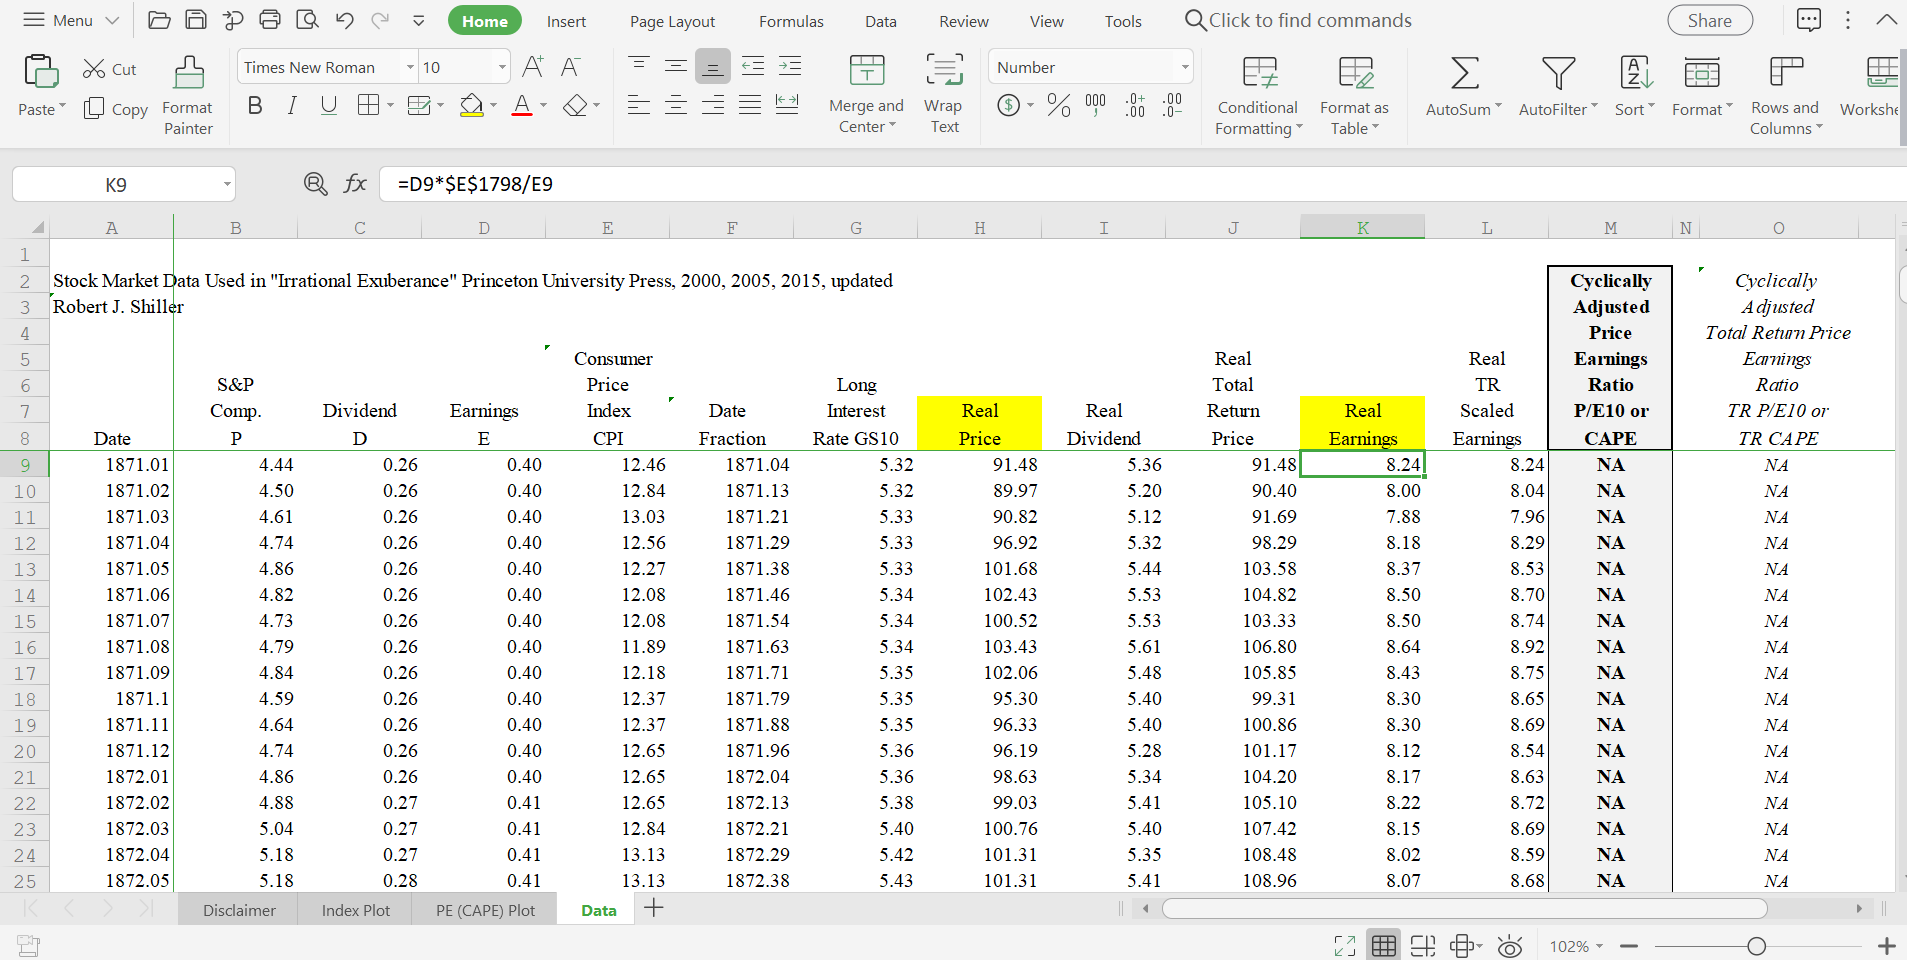
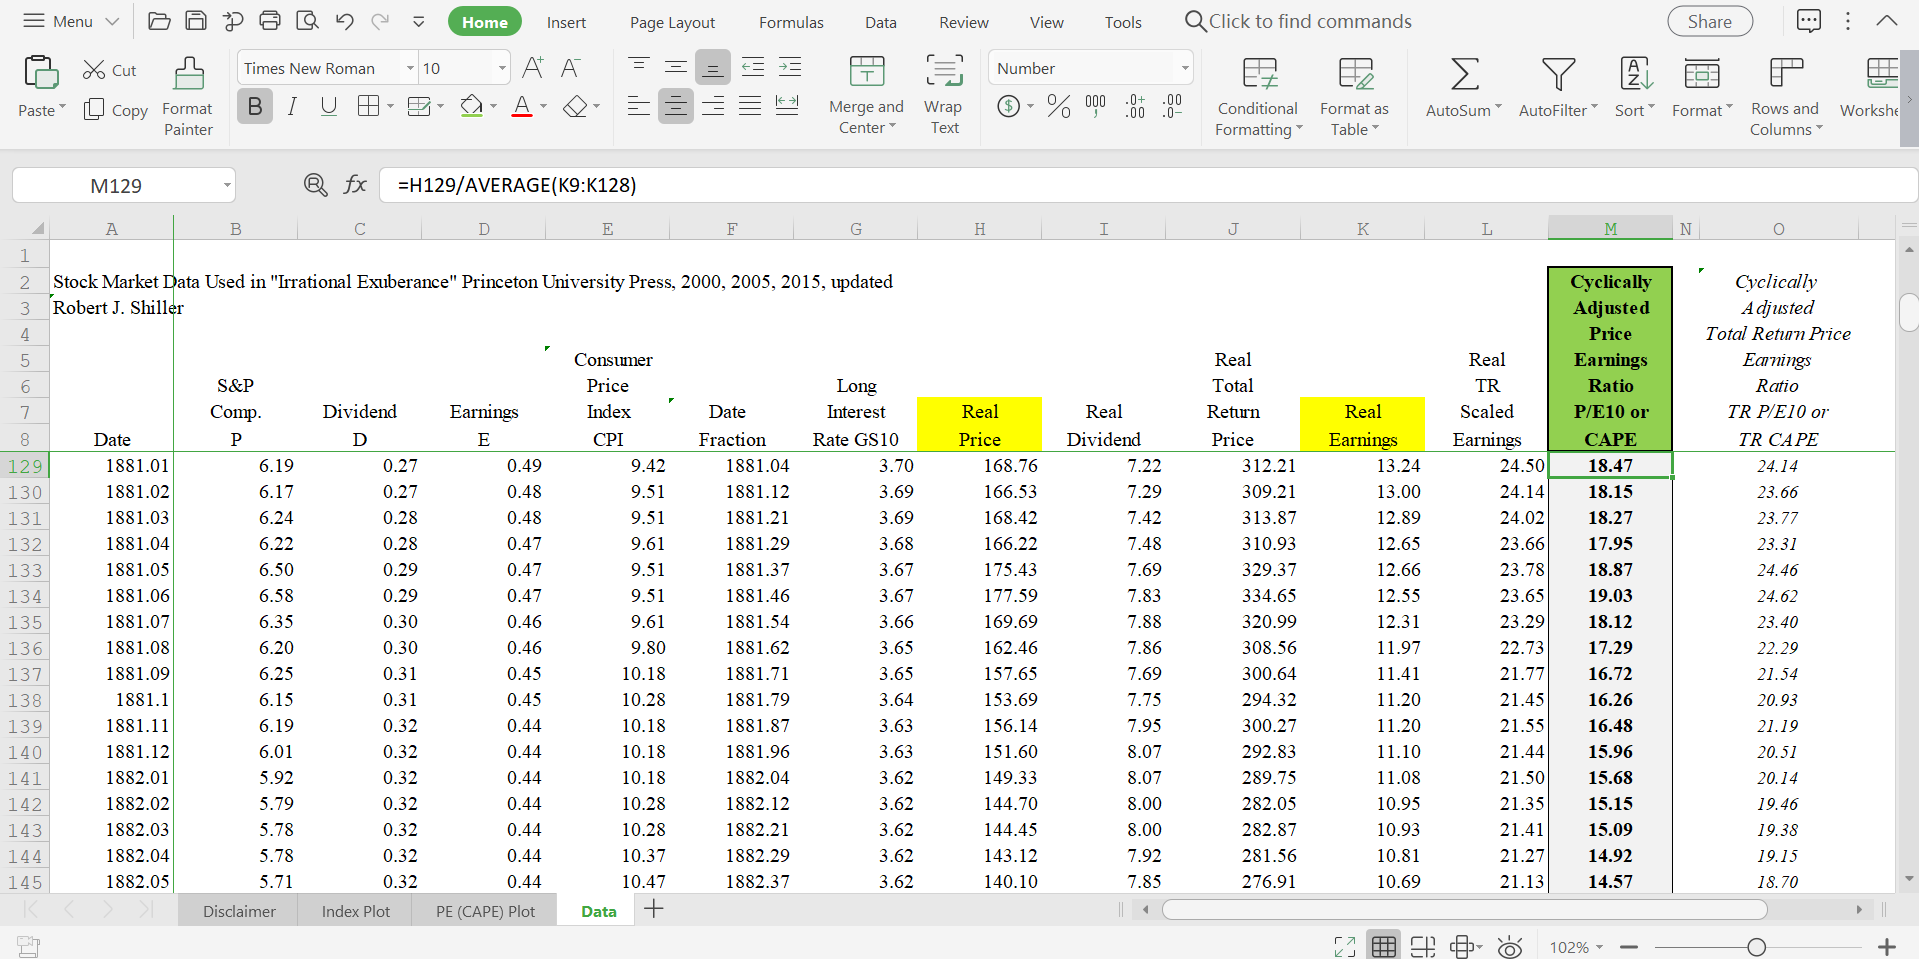
= Menu Cut Paste Copy Format Painter H9 A B Times New Roman B I U I> Home Insert Page Layout Formulas Data Review View Tools QClick to find commands Share 10 A A == H Number Merge and Center Wrap Text - % 000:00:00 Conditional Formatting Format as Table AutoSum AutoFilter * Sort Format Rows and Columns Workshe fx =B9*$E$1798/E9 F H J K L M N 1 2 Stock Market Data Used in "Irrational Exuberance" Princeton University Press, 2000, 2005, 2015, updated 3 Robert J. Shiller 4 5 Consumer Real 6 7 S&P Comp. Price 8 Date P Dividend D Earnings E Index Date Long Interest Total Real Real Return Real CPI Fraction Rate GS10 Price Dividend Price Earnings Real TR Scaled Earnings Cyclically Adjusted Price Earnings Ratio Cyclically Adjusted Total Return Price Earnings Ratio P/E10 or TR P/E10 or CAPE TR CAPE 9 1871.01 4.44 0.26 0.40 12.46 1871.04 5.32 91.48 5.36 91.48 8.24 8.24 10 1871.02 4.50 0.26 0.40 12.84 1871.13 5.32 89.97 5.20 90.40 8.00 8.04 11 1871.03 4.61 0.26 0.40 13.03 1871.21 5.33 90.82 5.12 91.69 7.88 7.96 12 1871.04 4.74 0.26 0.40 12.56 1871.29 5.33 96.92 5.32 98.29 8.18 8.29 13 1871.05 4.86 0.26 0.40 12.27 1871.38 5.33 101.68 5.44 103.58 8.37 8.53 14 1871.06 4.82 0.26 0.40 12.08 1871.46 5.34 102.43 5.53 104.82 8.50 8.70 NA 15 1871.07 4.73 0.26 0.40 12.08 1871.54 5.34 100.52 5.53 103.33 8.50 8.74 16 1871.08 4.79 0.26 0.40 11.89 1871.63 5.34 103.43 5.61 106.80 8.64 8.92 17 1871.09 4.84 0.26 0.40 12.18 1871.71 5.35 102.06 5.48 105.85 8.43 8.75 18 1871.1 4.59 0.26 0.40 12.37 1871.79 5.35 95.30 5.40 99.31 8.30 8.65 19 1871.11 4.64 0.26 0.40 12.37 1871.88 5.35 96.33 5.40 100.86 8.30 8.69 20 1871.12 4.74 0.26 0.40 12.65 1871.96 5.36 96.19 5.28 101.17 8.12 8.54 21 1872.01 4.86 0.26 0.40 12.65 1872.04 5.36 98.63 5.34 104.20 8.17 8.63 22 1872.02 4.88 0.27 0.41 12.65 1872.13 5.38 99.03 5.41 105.10 8.22 8.72 NA 23 1872.03 5.04 0.27 0.41 12.84 1872.21 5.40 100.76 5.40 107.42 8.15 8.69 24 1872.04 5.18 0.27 0.41 13.13 1872.29 5.42 101.31 5.35 108.48 8.02 8.59 25 1872.05 5.18 0.28 0.41 13.13 1872.38 5.43 101.31 5.41 108.96 8.07 8.68 K Disclaimer Index Plot PE (CAPE) Plot Data + 102% +
Step by Step Solution
There are 3 Steps involved in it
Step: 1

Get Instant Access to Expert-Tailored Solutions
See step-by-step solutions with expert insights and AI powered tools for academic success
Step: 2

Step: 3

Ace Your Homework with AI
Get the answers you need in no time with our AI-driven, step-by-step assistance
Get Started


