Answered step by step
Verified Expert Solution
Question
1 Approved Answer
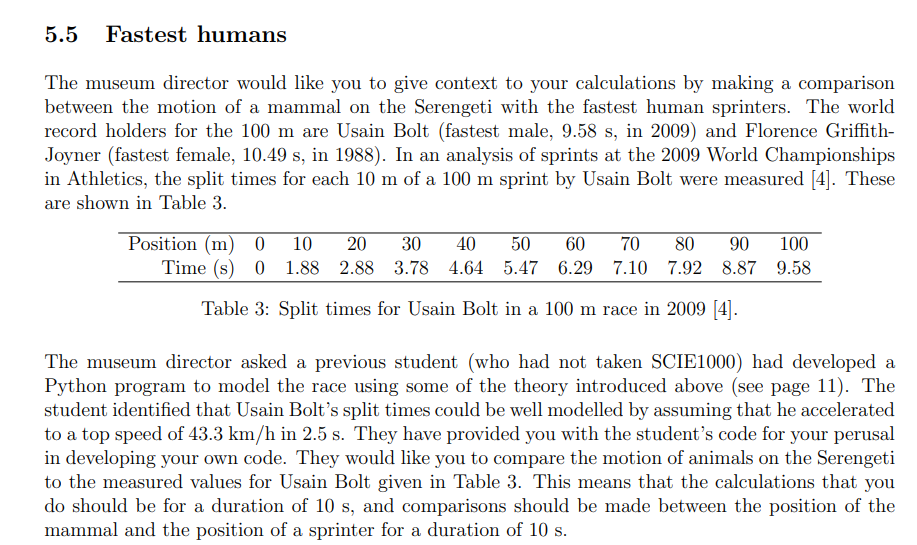
How can I model and fit the data of the fastest human to compare to the motion of a mammal which I calculated and plotted
How can I model and fit the data of the fastest human to compare to the motion of a mammal which I calculated and plotted it?
pls basic level of python and the only permitted libarey is pylab.
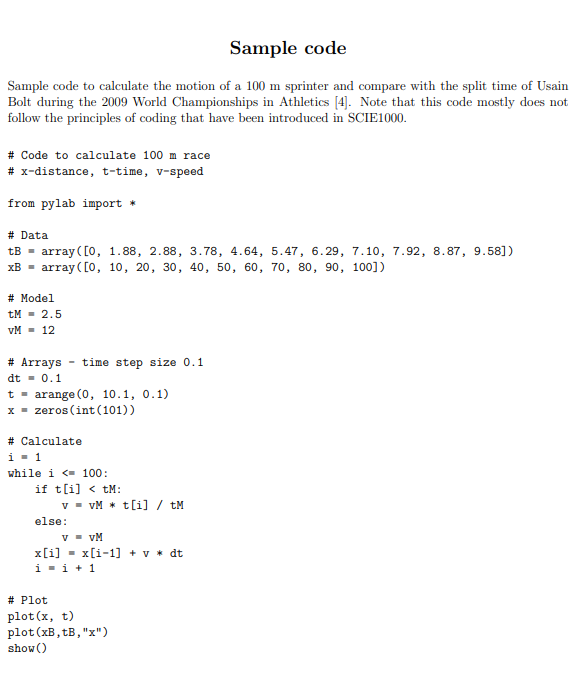
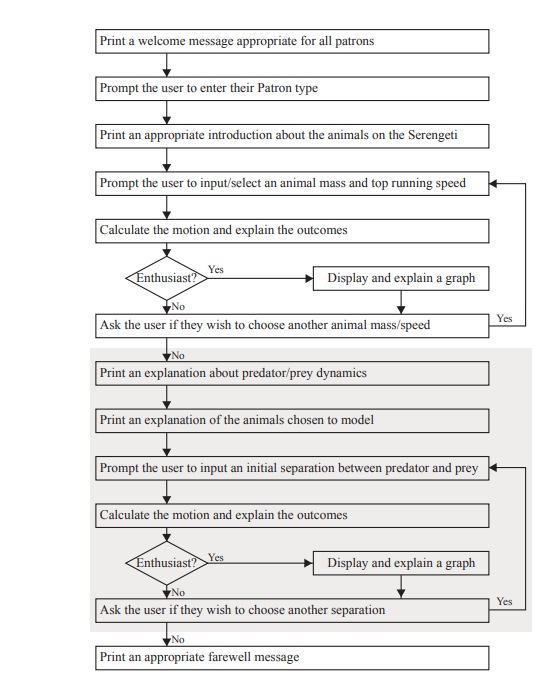
here is the task: #photo 3, flow chart #photo 2, sample code #photo1


from pylab import *
###################### Functions are defined here ###########################
# Constants
tts_predator = 7 # Time to give up for the predator (in seconds)
time_step = 0.1 # Time step for position calculation (in seconds)
# Power law equation for maximal running speed
def maximal_running_speed(mass):
return 10 ** (1.47832 + 0.25892 * log10(mass) - 0.06237 * (log10(mass)) ** 2)
# Power law equation for time to reach top speed
def time_to_reach_top_speed(mass):
return 10 ** (0.16 + 0.25 * log10(mass))
# function that asks the user to press "0" button to move through the program
def button(x):
x=float(input("Press 0 to continue: "))
return x
###################### main body of the code here ###########################
print("Hi there! Welcome to St Lucia Public Science Museum! This exhibition is called'Mother Nature, racing to survive'. Today we will explore the amazing life of animals in terms of chase and prey in order to survive.")
print("Have you ever wondered about the potential of animals, animals speed or chase and compareing the speed of fastes human on earth with them ?")
print("If you have, then prepare to be amazed. If you haven't, then prepare to be mindblown!")
# prompts user to enter their patron type
patron_type = float(input("Press 2 if you are a science rookie OR Press 1 if you are a scienceenthusiast: "))
# begin program for "science enthusiast"
if patron_type== 1:
# display intro about animals speed
print("The vast plains of the Serengeti comprise 1.5 million ha of savanna. The annual migrationto permanent water holes of vast herds of herbivores (wildebeest, gazelles and zebras),followed by their predators, is one of the most impressive natural events in the world.")
print("Can you guess how both predator and prey accelerate to chase/aviod their adversay?")
x=float(input("Press 0 to continue: "))
#explains maximal_running_speed
print("By using the function of maximum running speed equation we can calculate the speed of animals")
print()
button(x)
# start of loop so user can do multiple animals searches if they wish
# prompt the user to enter the values for mass_predator and mass_prey
mass_predator = float(input("Take a guess and enter choose a mass for the predator: "))
mass_prey = float(input("Take a guess and enter choose a mass for the prey: "))
# Mass of the predator (in kg)
max_speed_predator = maximal_running_speed(mass_predator)
print("This predators max speed is", max_speed_predator)
time_to_top_speed_predator = time_to_reach_top_speed(mass_predator)
print("The time to reach it's maximum speed is ", time_to_top_speed_predator)
max_speed_prey = maximal_running_speed(mass_prey)
print("This prey max speed is", max_speed_prey)
time_to_top_speed_prey = time_to_reach_top_speed(mass_prey)
maximal_running_speed
print("The time to reach it's maximum speed is ", time_to_top_speed_prey)
print()
print("If you want to see a plot ")
x=float(input("Press 0 to continue: "))
# use user inputs to set up variables used in functions that calculate orbital period,transit time and minimum relative intensity
log_mass = array([1.48, 1.78, 2.08, 2.38, 2.68])
log_time_to_top_speed = array([0.16, 0.41, 0.67, 0.93, 1.18])
# Calculate the values of a and b in the power law equation for time to reach top speed
a, b = polyfit(log_mass, log_time_to_top_speed, 1)
# Calculate the maximal running speed and time to reach top speed for the predator and prey
mass_predator = 45 # Mass of the predator (in kg)
mass_prey = 250 # Mass of the prey (in kg)
max_speed_predator = maximal_running_speed(mass_predator)
max_speed_prey = maximal_running_speed(mass_prey)
time_to_top_speed_predator = time_to_reach_top_speed(mass_predator)
time_to_top_speed_prey = time_to_reach_top_speed(mass_prey)
# Calculate the number of time steps for the chase
num_steps = int(tts_predator / time_step)
# Arrays to store positions and times
positions_predator = zeros(num_steps)
positions_prey = zeros(num_steps)
times = zeros(num_steps)
# Calculate positions and times for each time step
for i in range(num_steps):
# Calculate current time
times[i] = i * time_step
# Calculate current speed for the predator and prey
if times[i] < time_to_top_speed_predator:
speed_predator = times[i] * max_speed_predator / time_to_top_speed_predator
else:
speed_predator = max_speed_predator
if times[i] < time_to_top_speed_prey:
speed_prey = times[i] * max_speed_prey / time_to_top_speed_prey
else:
speed_prey = max_speed_prey
# Calculate current positions for the predator and prey
if i > 0:
positions_predator[i] = positions_predator[i-1] + speed_predator * time_step
positions_prey[i] = positions_prey[i-1] + speed_prey * time_step
else:
positions_predator[i] = speed_predator * time_step
positions_prey[i] = speed_prey * time_step
# Print the positions and times
for i in range(num_steps-1):
print("Time:", times[i], "s - Predator Position:", positions_predator[i], "m - Prey Position:", positions_prey[i], "m")
# Plot the positions of the predator and prey
plot(times, positions_predator, 'o-', label='Predator')
plot(times, positions_prey, 'o-', label='Prey')
# Set the axis labels and title
xlabel('Time (s)')
ylabel('Position (m)')
title('Predator-Prey comprison')
print("As you can see the above graph show the position of a preditor and a prey in time period of 7 second which basically the the time that a mammal reaches it's maximum speed which can determine it's position in chase situation")
# Add a legend
legend()
# Show the plot
show()
if patron_type== 2:
print("so your a science rookie")
Sample code Sample code to calculate the motion of a 100 m sprinter and compare with the split time of Usain Bolt during the 2009 World Championships in Athletics [4]. Note that this code mostly does not follow the principles of coding that have been introduced in SCIE1000. # Code to calculate 100 m race # x-distance, t-time, v-speed from pylab import * # Data tB= array([0, 1.88, 2.88, 3.78, 4.64, 5.47, 6.29, 7.10, 7.92, 8.87, 9.58]) xBarray ( [0, 10, 20, 30, 40, 50, 60, 70, 80, 90, 100]) # Model tM = 2.5 VM = 12 # Arrays dt = 0.1 time step size 0.1 tarange (0, 10.1, 0.1) x = zeros(int (101)) # Calculate i=1 while i < 100: if t[i]
Step by Step Solution
There are 3 Steps involved in it
Step: 1

Get Instant Access to Expert-Tailored Solutions
See step-by-step solutions with expert insights and AI powered tools for academic success
Step: 2

Step: 3

Ace Your Homework with AI
Get the answers you need in no time with our AI-driven, step-by-step assistance
Get Started


