Question
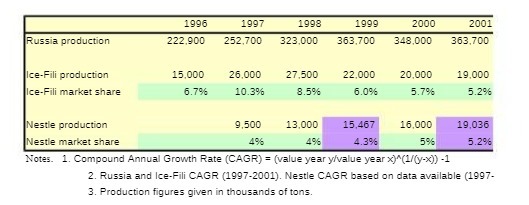
How did this person get the values in the purple excel cells? 1996 Russia production 222,900 1997 1998 252,700 323,000 1999 2000 2001 363,700 348,000

1996 Russia production 222,900 1997 1998 252,700 323,000 1999 2000 2001 363,700 348,000 363,700 Ice-Fili production 15,000 26,000 27,500 22.000 20,000 19.000 Ice-Fili market share 6.7% 10.3% 8.5% 6.0% 5.7% 5.2% Nestle production Nestle market share 9.500 4% 13,000 4% 15,467 4.3% 16,000 5% 19,036 5.2% Notes. 1. Compound Annual Growth Rate (CAGR) = (value year y/value year x)^(1/(y-x)) -1 2. Russia and Ice-Fili CAGR (1997-2001). Nestle CAGR based on data available (1997- 3. Production figures given in thousands of tons.
Step by Step Solution
There are 3 Steps involved in it
Step: 1

Get Instant Access to Expert-Tailored Solutions
See step-by-step solutions with expert insights and AI powered tools for academic success
Step: 2

Step: 3

Ace Your Homework with AI
Get the answers you need in no time with our AI-driven, step-by-step assistance
Get StartedRecommended Textbook for
Introduction To Business Statistics
Authors: Ronald M. Weiers
6th Edition
0324381433, 978-0324381436
Students also viewed these Accounting questions
Question
Answered: 1 week ago
Question
Answered: 1 week ago
Question
Answered: 1 week ago
Question
Answered: 1 week ago
Question
Answered: 1 week ago
Question
Answered: 1 week ago
Question
Answered: 1 week ago
Question
Answered: 1 week ago
Question
Answered: 1 week ago
Question
Answered: 1 week ago
Question
Answered: 1 week ago
Question
Answered: 1 week ago
Question
Answered: 1 week ago
Question
Answered: 1 week ago
Question
Answered: 1 week ago
Question
Answered: 1 week ago
Question
Answered: 1 week ago
Question
Answered: 1 week ago
Question
Answered: 1 week ago
Question
Answered: 1 week ago
Question
Answered: 1 week ago
Question
Answered: 1 week ago
View Answer in SolutionInn App


