Below are the financial statements for two firms, Time Warner and Walt Disney, for 2012 and 2013. a. How did Time Warner's profit margins change
Below are the financial statements for two firms, Time Warner and Walt Disney, for 2012 and 2013.
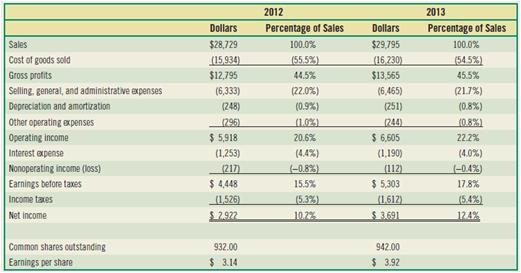
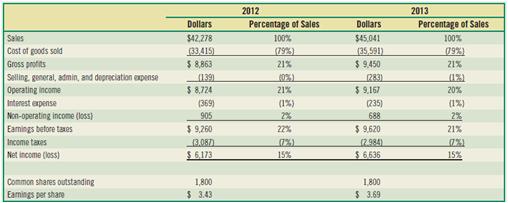
a. How did Time Warner's profit margins change from 2012 to 2013? To what would you attribute the differences? Answer the same question for Disney.
b. Compare the profit margins between Time Warner and Disney. How are they different? How would you explain these differences?
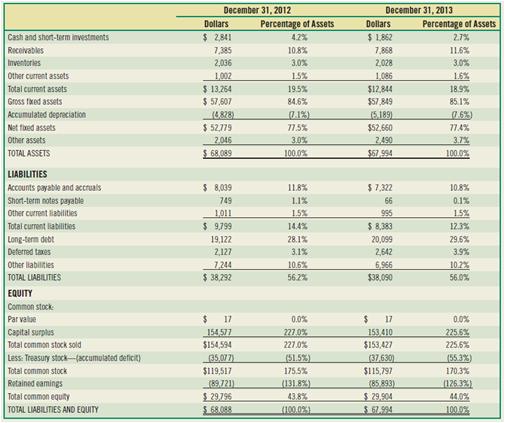
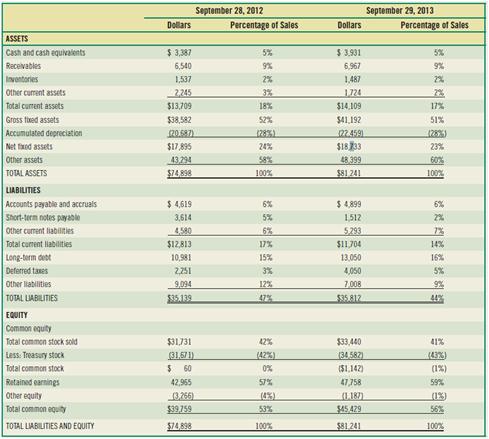
c. What differences do you notice in the common-sized balance sheets that might indicate that one of the firms is doing better than the other?
Time Warner, Inc. Balance Sheet and Common-Sized Balance Sheet for Years Ending December 31, 2012 and December 31, 2013 ($ millions)
Walt Disney Co. Annual Income Statement for Years Ending September 28, 2012 and September 29, 2013 (in $ millions except earnings per share)
Walt Disney Co. Balance Sheet
for Years Ending September 28, 2012 and September 29, 2013 ($ millions)
2012 2013 Dollars Percentage of Sales Dollars Percentage of Sales Sales $28,729 100.0% $29,795 100.0% Cost of goods sold (15,934) (55.5%) (16.230) (54.5%) Gross profits $12,795 44.5% $13,565 45.5% Selling. general, and administrative expenses (6,333) (22.0%) (6,465) (21.7%) Depreciation and amortzation (248) (0.9%) (251) (0.8%) Other operating expenses (296) (1.0%) 244) 10.8%) Operating income $ 5,918 20.6% $ 6,605 22.2% Interest expense Nonoperating income (loss) Earnings before taxes (1,253) (4.4%) (1.190) (4.0%) (217) $ 4,448 -0.8%) (112) (-0.4%) 15.5% $ 5.303 17.8% Income taxes (1,526) (5.3%) (1.612) (5.4%) Net income 12972 10.2% S3.691 12.4% Common shares outstanding 932.00 942.00 Earnings per share $ 3.14 $ 3.92
Step by Step Solution
3.38 Rating (145 Votes )
There are 3 Steps involved in it
Step: 1

See step-by-step solutions with expert insights and AI powered tools for academic success
Step: 2

Step: 3

Ace Your Homework with AI
Get the answers you need in no time with our AI-driven, step-by-step assistance
Get Started


