how do i answer these
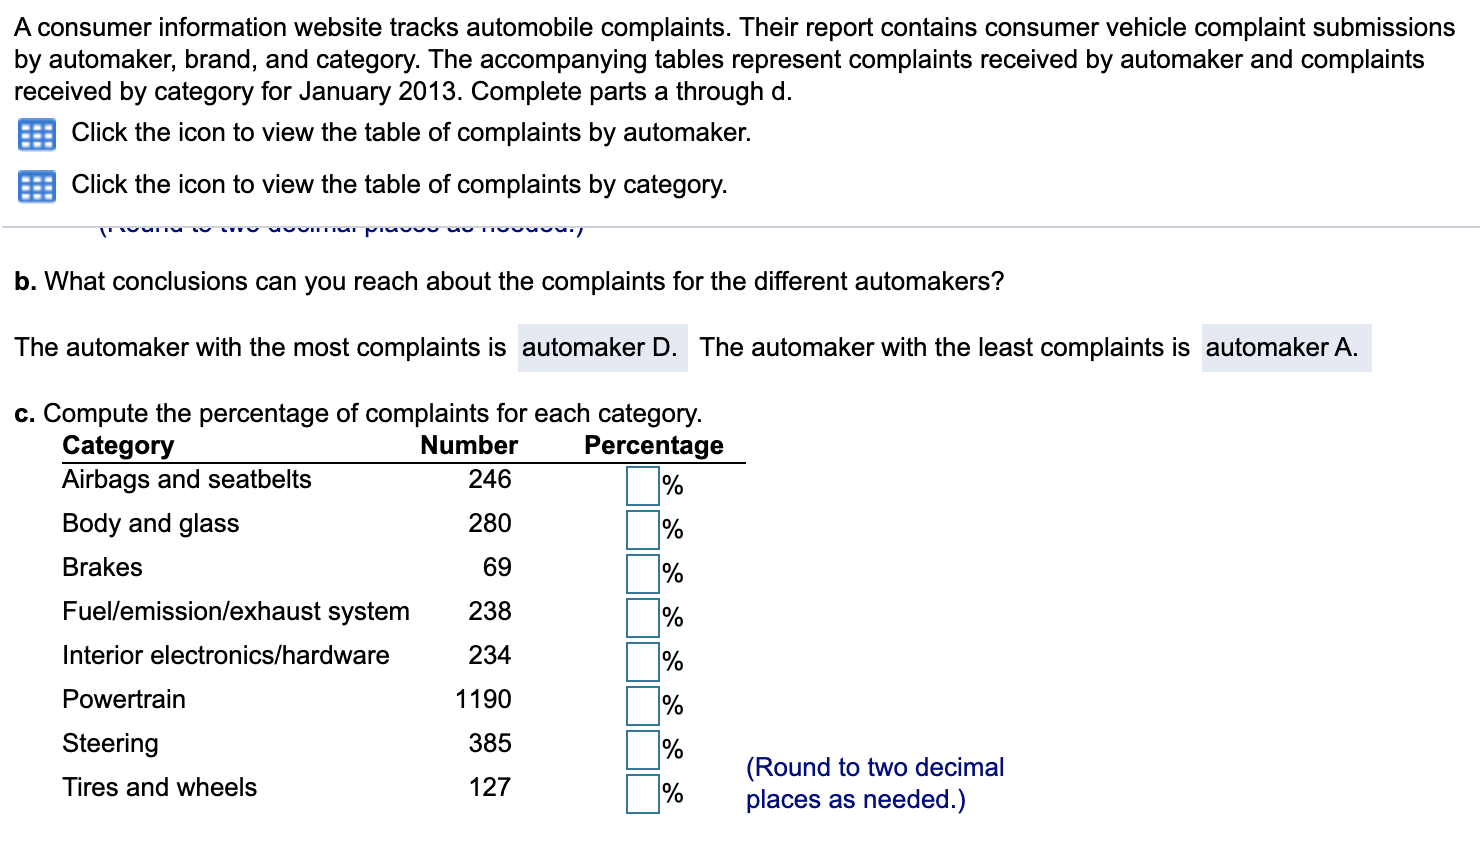
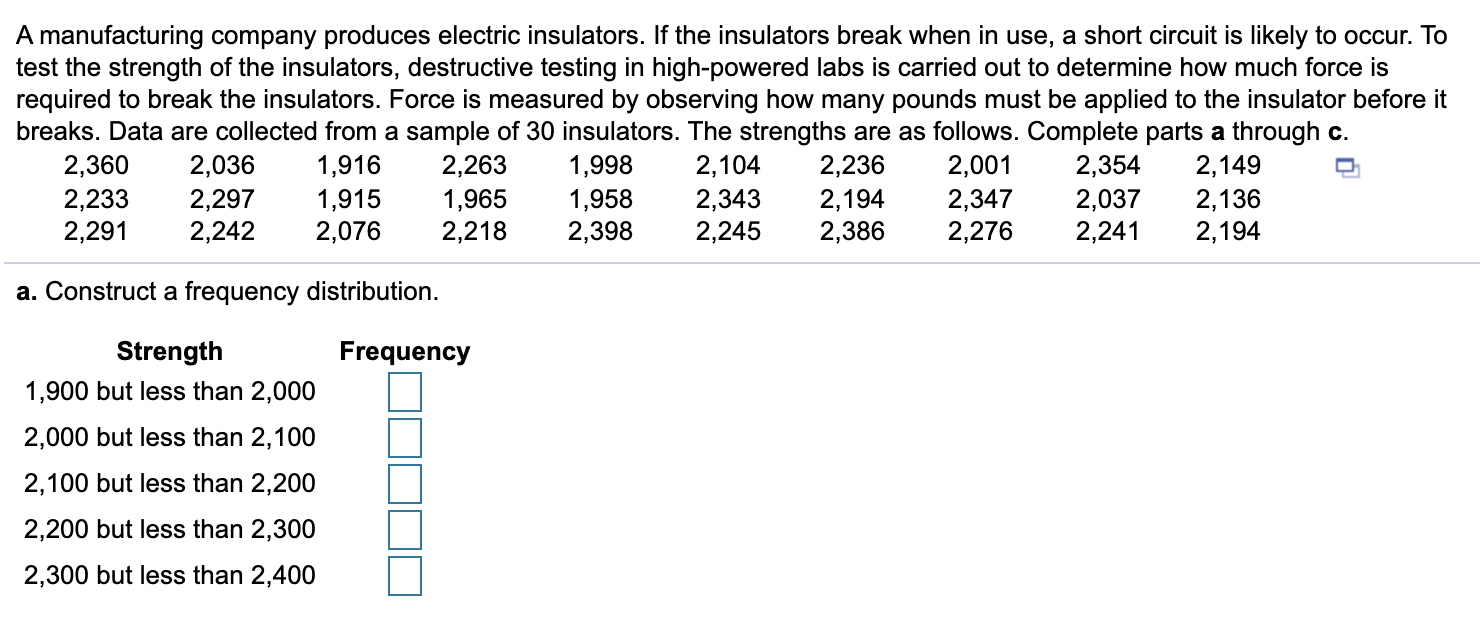
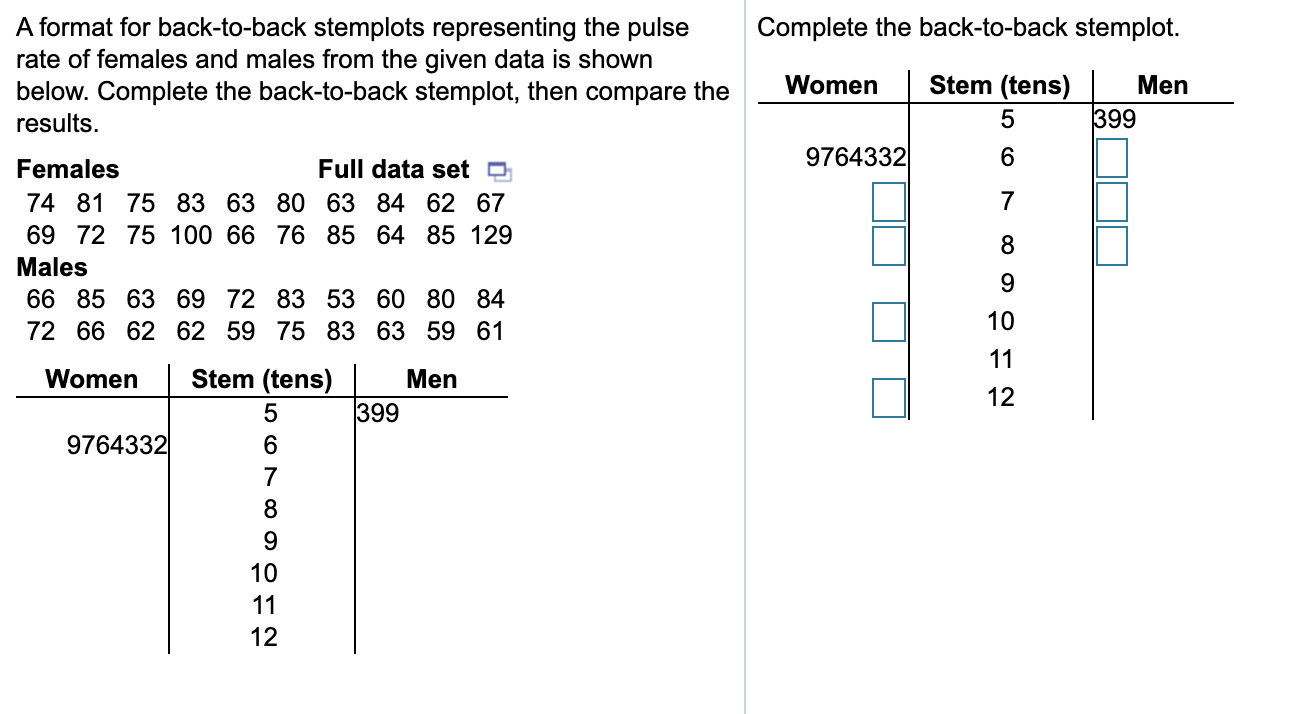
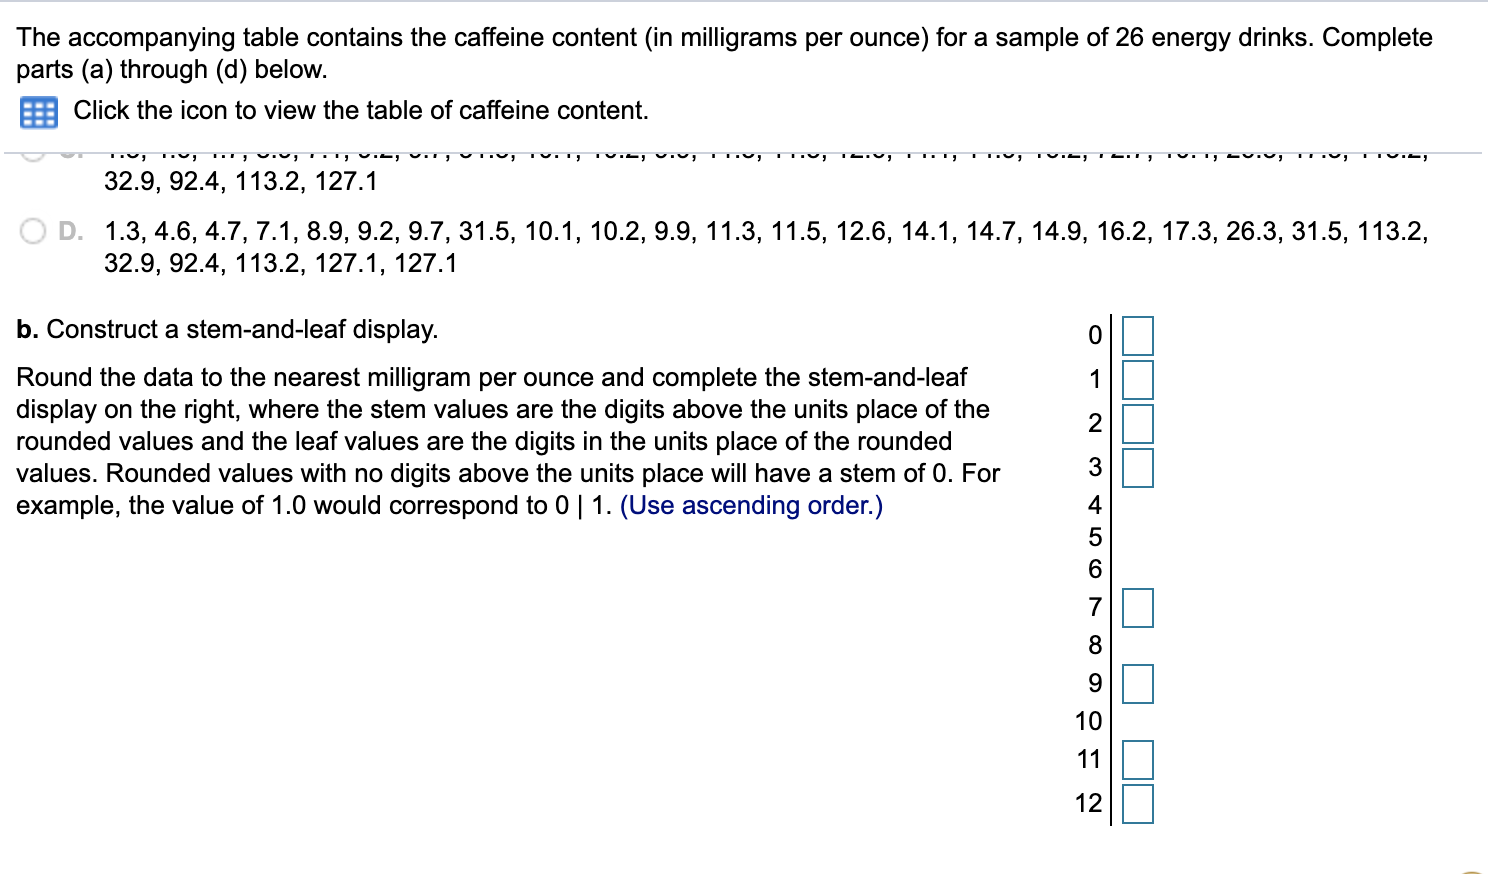
A consumer information website tracks automobile complaints. Their report contains consumer vehicle complaint submissions by automaker, brand, and category. The accompanying tables represent complaints received by automaker and complaints received by category for January 2013. Complete parts a through d. Click the icon to view the table of complaints by automaker. Click the icon to view the table of complaints by category. b. What conclusions can you reach about the complaints for the different automakers? The automaker with the most complaints is automaker D. The automaker with the least complaints is automaker A. c. Compute the percentage of complaints for each category. Category Number Percentage Airbags and seatbelts 246 % Body and glass 280 % Brakes 69 10 Fuel/emission/exhaust system 238 % Interior electronics/hardware 234 70 Powertrain 1190 % Steering 385 % (Round to two decimal Tires and wheels 127 % places as needed.)A manufacturing company produces electric insulators. If the insulators break when in use, a short circuit is likely to occur. To test the strength of the insulators, destructive testing in high-powered labs is carried out to determine how much force is required to break the insulators. Force is measured by observing how many pounds must be applied to the insulator before it breaks. Data are collected from a sample of 30 insulators. The strengths are as follows. Complete parts a through c. 2,360 2,036 1,916 2,263 1,998 2,104 2,236 2,001 2,354 2,149 B 2,233 2,297 1,915 1,965 1,958 2,343 2,194 2,347 2,037 2,136 2,291 2,242 2,076 2,218 2,398 2,245 2,386 2,276 2,241 2,194 a. Construct a frequency distribution. Strength Frequency 1,900 but less than 2,000 2,000 but less than 2,100 2,100 but less than 2,200 2,200 but less than 2,300 2,300 but less than 2,400 |:l|:l|:l|:ll:l A format for back-to-back stemplots representing the pulse Complete the back-to-back stemplot. rate of females and males from the given data is shown below. Complete the back-to-back stemplot, then compare the Women Stem (tens) Men results. 399 Females Full data set 9764332 74 81 75 83 63 80 63 84 62 67 69 72 75 100 66 76 85 64 85 129 Males 66 85 63 69 72 83 53 60 80 84 6 6 0 00 72 66 62 62 59 75 83 63 59 61 Women Stem (tens) Men 399 9764332 9 12The accompanying table contains the caffeine content (in milligrams per ounce) for a sample of 26 energy drinks. Complete parts (a) through (d) below. Click the icon to view the table of caffeine content. 32.9, 92.4, 113.2, 127.1 O D. 1.3, 4.6, 4.7, 7.1, 8.9, 9.2, 9.7, 31.5, 10.1, 10.2, 9.9, 11.3, 11.5, 12.6, 14.1, 14.7, 14.9, 16.2, 17.3, 26.3, 31.5, 113.2, 32.9, 92.4, 113.2, 127.1, 127.1 b. Construct a stem-and-leaf display. O Round the data to the nearest milligram per ounce and complete the stem-and-leaf display on the right, where the stem values are the digits above the units place of the rounded values and the leaf values are the digits in the units place of the rounded values. Rounded values with no digits above the units place will have a stem of 0. For example, the value of 1.0 would correspond to 0 | 1. (Use ascending order.) O O N O) UI A W N - 11 12The accompanying table contains the caffeine content (in milligrams per ounce) for a sample of 26 energy drinks. Complete parts (a) through (d) below. E Click the icon to view the table of caffeine content. a. Construct an ordered array. Choose the correct answer below. A. 127.1, 113.2, 92.4, 72.7, 32.9, 31.5, 26.3, 17.3, 16.2, 14.9, 14.7, 14.1, 12.6, 11.5, 11.3, 10.4, 10.2, 10.1, 9.9, 9.7, 9.2, 8.9, 7.1, 4.7, 4.6, 1.3 33 1.3, 4.6, 4.7, 7.1, 8.9, 9.2, 9.7, 9.9, 10.1,10.2,10.4, 11.3, 11.5, 12.6, 14.1, 14.7, 14.9, 16.2, 17.3, 26.3, 31.5, 32.9, 72.7, 92.4, 113.2, 127.1 c. 1.3, 4.6, 4.7, 6.9, 7.1, 9.2, 9.7, 31.5, 10.1, 10.2, 9.9, 11.3, 11.5, 12.6, 14.1, 14.9, 16.2, 72.7, 10.4, 26.3, 17.3, 113.2, 32.9, 92.4, 113.2, 127.1 D. 1.3, 4.6, 4.7, 7.1, 8.9, 9.2, 9.7, 31.5,10.1, 10.2, 9.9, 11.3, 11.5, 12.6, 14.1, 14.7, 14.9,16.2,17.3,26.3,31.5, 113.2, 32.9, 92.4, 113.2, 127.1, 127.1 b. Construct a stem-and-leaf display. Round the data to the nearest milligram per ounce and complete the stem-and-leaf display on the right, where the stern values are the digits above the units place of the rounded values and the leaf values are the digits in the units place of the rounded values. Rounded values with no digits above the units place will have a stem of 0. For example, the value of 1.0 would correspond to 0 | 1. (Use ascending order.) |:l|:l|:l|:l I-h-OON'O