

Answered step by step
Verified Expert Solution
Question
1 Approved Answer
how do I calculate times intrest earned, on the financial statement of ratios chart. Gene miller 0 Share elp F IMN 761,602 1,737 73,627 1,419,104
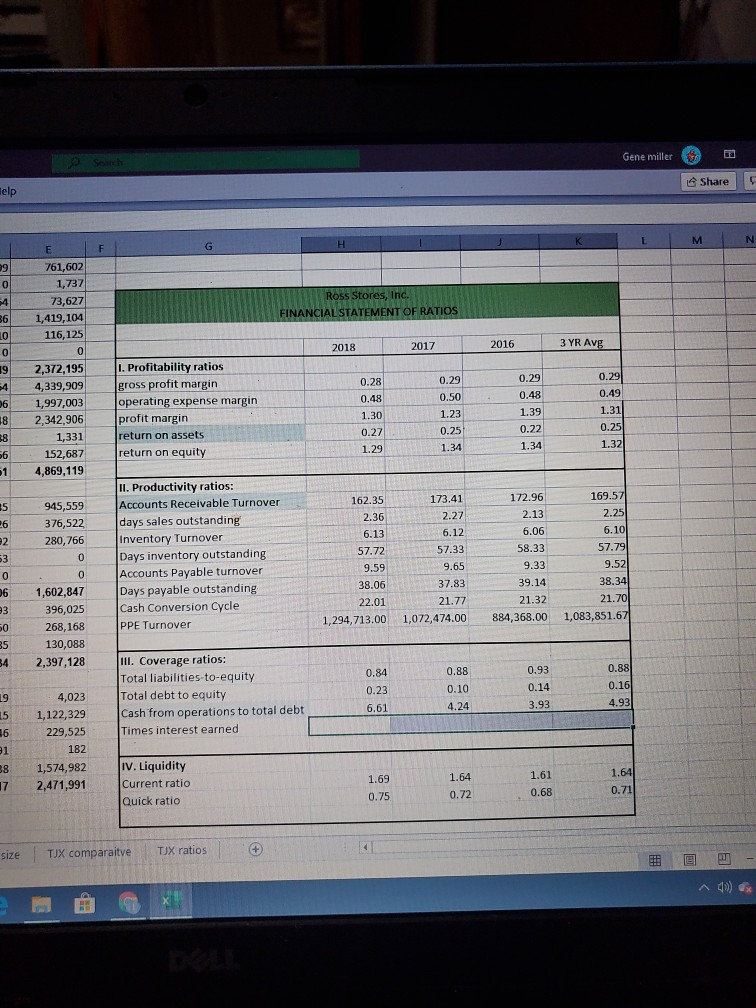
how do I calculate times intrest earned, on the financial statement of ratios chart.
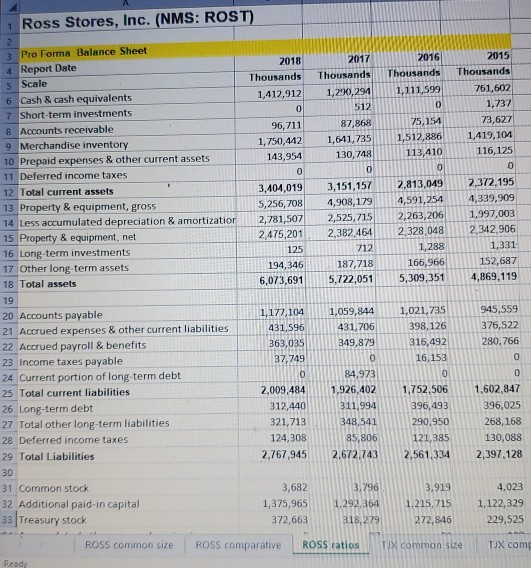
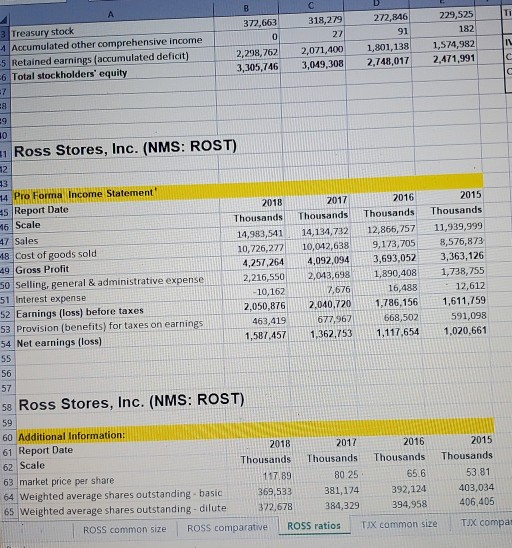
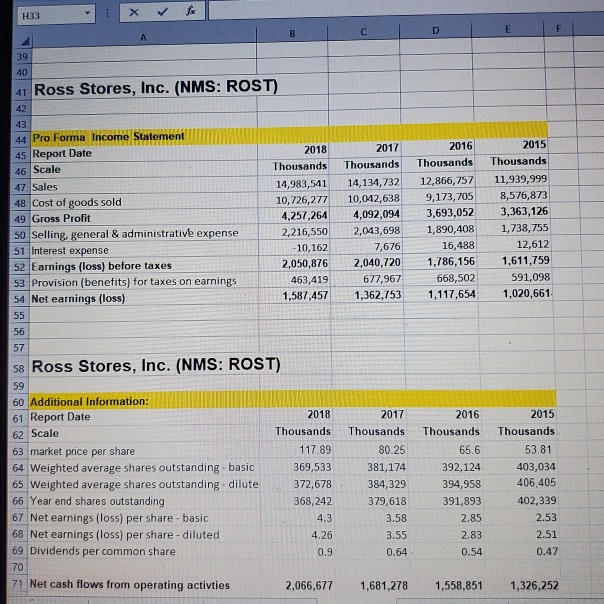
Gene miller 0 Share elp F IMN 761,602 1,737 73,627 1,419,104 116,125 Ross Stores, Inc. FINANCIAL STATEMENT OF RATIO 2018 2017 2016 3 YR Avg 9 0.29 0.29 0.49 16 8 2,372,195 4,339,909 1,997,003 2,342,906 1,331 152,687 4,869,119 I. Profitability ratios gross profit margin operating expense margin profit margin return on assets return on equity 0.28 0.48 1.30 0.27 1.29 0.29 0.50 1.23 0.25 1.34 0.48 1.39 0.22 1.34 0.25 16 1.32 945,559 376,522 280,766 0 NOM II. Productivity ratios: Accounts Receivable Turnover days sales outstanding Inventory Turnover Days inventory outstanding Accounts Payable turnover Days payable outstanding Cash Conversion Cycle PPE Turnover 162.35 2.36 6.13 57.72 9.59 38.06 22.01 1,294,713.00 2.27 6.12 57.33 9.65 37.83 21.77 1,072,474.00 172.96 2.13 6.06 58.33 9.33 39.14 21.32 884,368.00 169.57 2.25 6.100 57.79 9.52 38.34 21.70 1,083,851.67 1,602,847 396,025 268,168 130,088 2,397,128 III. Coverage ratios: Total liabilities-to-equity Total debt to equity Cash from operations to total debt Times interest earned 0.84 0.23 6.61 0.88 0.10 4.24 0.93 0.14 3.93 0.88 0.16 4.93 4,023 1,122,329 229,525 182 1,574,982 2,471,991 IV. Liquidity Current ratio Quick ratio 1.69 0.75 1.64 0.72 1.61 0.68 ize TX comparaitve TIX ratios Ross Stores, Inc. (NMS: ROST) 2018 Thousands 1,412,912 0 96,711 1,750,442 143,954 2017 2016 Thousands Thousands 1,290,294 1,111,599 512 87,868 75,154 1,641,735 1,512,886 130,748 113,410 2015 Thousands 761,602 1,737 73,627 1,419,104 116,125 3,404,019 3,151, 157 5,256,708 4,908,179 2,781,5072,525,715 2,475,201 2,382,464 125 194,346 187,718 6,073,691 15,722,051 2,813,0492,372,195 4,591,254 4,339,909 2,263,206 1.997,003 2,328,048 2,342,906 1,331 166,966 152,687 5,309,351 4,869,119 712 3 Pro Forma Balance Sheet 4 Report Date 5 Scale 6 Cash & cash equivalents 7 Short-term investments & Accounts receivable . 9 Merchandise inventory 10 Prepaid expenses & other current assets 11 Deferred income taxes 12 Total current assets 13 Property & equipment, gross 14 Less accumulated depreciation & amortization 15 Property & equipment, net 16 Long-term investments 17 Other long-term assets 18 Total assets 19 20 Accounts payable 21 Accrued expenses & other current liabilities 22 Accrued payroll & benefits 23 Income taxes payable 24 Current portion of long-term debt 25 Total current liabilities 26 Long-term debt 27 Total other long-term liabilities 28 Deferred income taxes 29 Total Liabilities 30 31 Common stock 32 Additional paid in capital 33 Treasury stock 1,288 1,177,104 431,596 363,035 945,559 376,522 280,766 7749 1,059,844 1,021,735 431,706 398, 126 349,879 316,492 16,153 84,973 1,926,402 1,752,506 311,994 396,493 348,541 290,950 85,806 121,385 2,672,7432,561,334 2,009,484 312,440 321,713 124,308 2,767,945 1,602,847 396,025 268,168 130,088 2,397 128 3,682 1,375,965 372,663 3.796 1,292,364 3,919 1,215,715 272,846 4,023 1,122,329 229,525 ROSS common size ROSS comparative ROSS ratios TX common size TUX com Ready DE 372,663 318,279 - A 3 Treasury stock 4 Accumulated other comprehensive income 5 Retained earnings (accumulated deficit) 6 Total stockholders' equity 272,846 91 1,801,138 2,748,017 229,525 182 1,574,982 2,471,991 2,298,762 3,305,746 2,071,400 3,049,308 Ross Stores, Inc. (NMS: ROST) 4 Pro Forma Income Statement es Report Date 6 Scale 47 Sales 18 Cost of goods sold 49 Gross Profit So Selling general & administrative expense 51 Interest expense 52 Earnings (loss) before taxes 53 Provision (benefits) for taxes on earnings 54 Net earnings (loss) 2018 Thousands 14,983,541 10,726,277 4,257,264 2,216,550 -10,162 2,050,876 463,419 1,587.457 Thousands 14,134,732 10,042,638 4,092,094 2,043,698 7,676 2,040,720 677.967 1362,753 2016 Thousands 12,865,757 9,173,705 3,693,052 1,890,408 16,488 1,786,156 668,502 1,117,654 2015 Thousands 11,939,999 8,576,873 3,363,126 1,738,755 12,612 1,611,759 591,098 1,020,661 58 Ross Stores, Inc. (NMS: ROST) 59 60 Additional 61 Report Date 2017 2016 62 Scale Thousands Thousands Thousands 63 market price per share 117.89 80 25 65.6 64 Weighted average shares outstanding basic 369,533 381,174 392,124 65 Weighted average shares outstanding-dilute 372,678 384,329 394,958 ROSS common size ROSS comparative ROSS ratios TJX common size 2015 Thousands 53.81 403,034 406,405 x & c ID EFI 41 Ross Stores, Inc. (NMS: ROST) 43 44 Pro Forma Income Statement 45 Report Date 46 Scale 47 Sales 48 Cost of goods sold 49 Gross Profit 50 Selling, general & administrative expense 51 Interest expense 52 Earnings (loss) before taxes 53 Provision (benefits) for taxes on earnings 54 Net earnings (loss) 2018 2017 2016 Thousands Thousands Thousands 14,983,541 14,134,732 12,866,757 10,726,277 10,042,638 9,173,705 4,257,264 4,092,0943 ,693,052 2,216,550 2,043,698 1,890,408 -10,162 7,676 16,488 2,050,876 2,040,720 1,786,156 463,419 677,967 668,502 1,587,4571,362,753 1,117,654 2015 Thousands 11,939,999 8,576,873 3,363,126 1,738,755 12,612 1,611,759 591,098 1,020,661 58 Ross Stores, Inc. (NMS: ROST) 60 Additional Information: 61 Report Date 62 Scale 63 market price per share 64 Weighted average shares outstanding basic 65 Weighted average shares outstanding dilute 66 Year end shares outstanding 67 Net earnings (loss) per share-basic 68 Net earnings (loss) per share-diluted 69 Dividends per common share 2018 Thousands 117.89 369,533 372,678 368,242 4.3 4.26 2017 Thousands 80.25 381,174 384,329 379,618 3.58 3.55 0.64 2016 Thousands 65.6 392,124 394,958 391,893 2.85 2.83 0.54 2015 Thousands 53.81 403,034 406,405 402,339 2.53 2.51 0.47 0.9 70 71 Net cash flows from operating activties 2,066,677 1,681,278 1,558,851 1,326,252Step by Step Solution
There are 3 Steps involved in it
Step: 1

Get Instant Access to Expert-Tailored Solutions
See step-by-step solutions with expert insights and AI powered tools for academic success
Step: 2

Step: 3
Ace Your Homework with AI
Get the answers you need in no time with our AI-driven, step-by-step assistance
Get Started
Financial Whirlpools A Systems Story Of The Great Global Recession
Authors: Karen L. Higgins
1st Edition
0124059058,012405921X