

Question
How do I fix this as it was wrong Instructions Statistical Analyses- Due Week 7 Select two relevant variables from the GSS dataset based on
How do I fix this as it was wrong
Instructions Statistical Analyses- Due Week 7
Select two relevant variables from the GSS dataset based on the identified problem/issue as presented in the introduction portion of the assignment. See Abbott (2017) Chapter 9: Excel Procedures with One-way ANOVA for the steps on completing the analysis, and Abbott (2017) Chapter 9: Figures 9.9 & 9.10 for how the data needs to be set up in Excel so that it can perform the appropriate one-way ANOVA. You will find it helpful to review Abbott (2017)'s example for the statistical interpretation/important factors to include as presented in Chapter 9: Post Hoc Analysis. The overall presentation of Abbott (2017)'s example can be found in Chapter 9: Are the Assumptions Met?
- You do NOT need to evaluate whether the population is normally distributed.
- You do NOT need to check for homogeneity of variance.
- You will calculate eta square's effect size using the Excel output information as listed in Abbott (2017) Chapter 9: SPSS Procedures with One-Way ANOVA.
- You will perform a post hoc analysis using Tukey Range test. See Abbott (2017) Chapter 9: Figure 9.16.
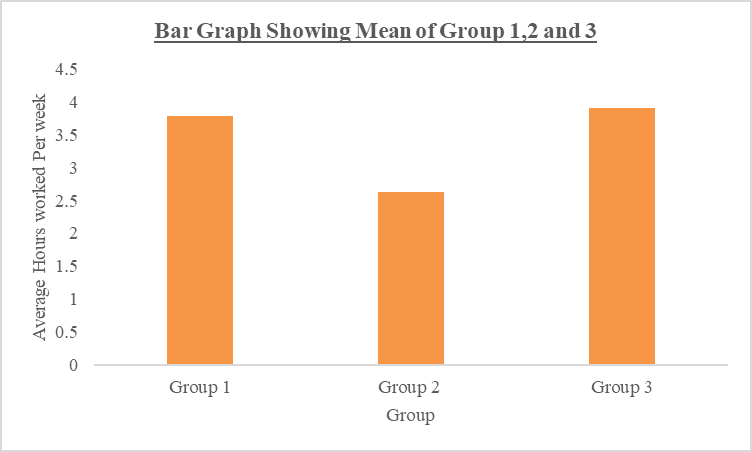
- You will create a bar graph displaying the 3 or 4 groups you chose as listed Abbott (2017) Chapter 9: Figure 9.13.
Copy and paste into the information you have generated in the statistical findings assignment for Week 7 into the "Final Project" document you submitted in the introduction assignment in Week 6. The goal is that all three parts of the final project will flow within one document. Once you have copied in the relevant information as outlined in the instructions above for Week 7, upload the new, more completed version of the "Final Project" into the Final Project in Week 7 - Statistical Analysis column for assignments in Blackboard.
This is the teacher's comment
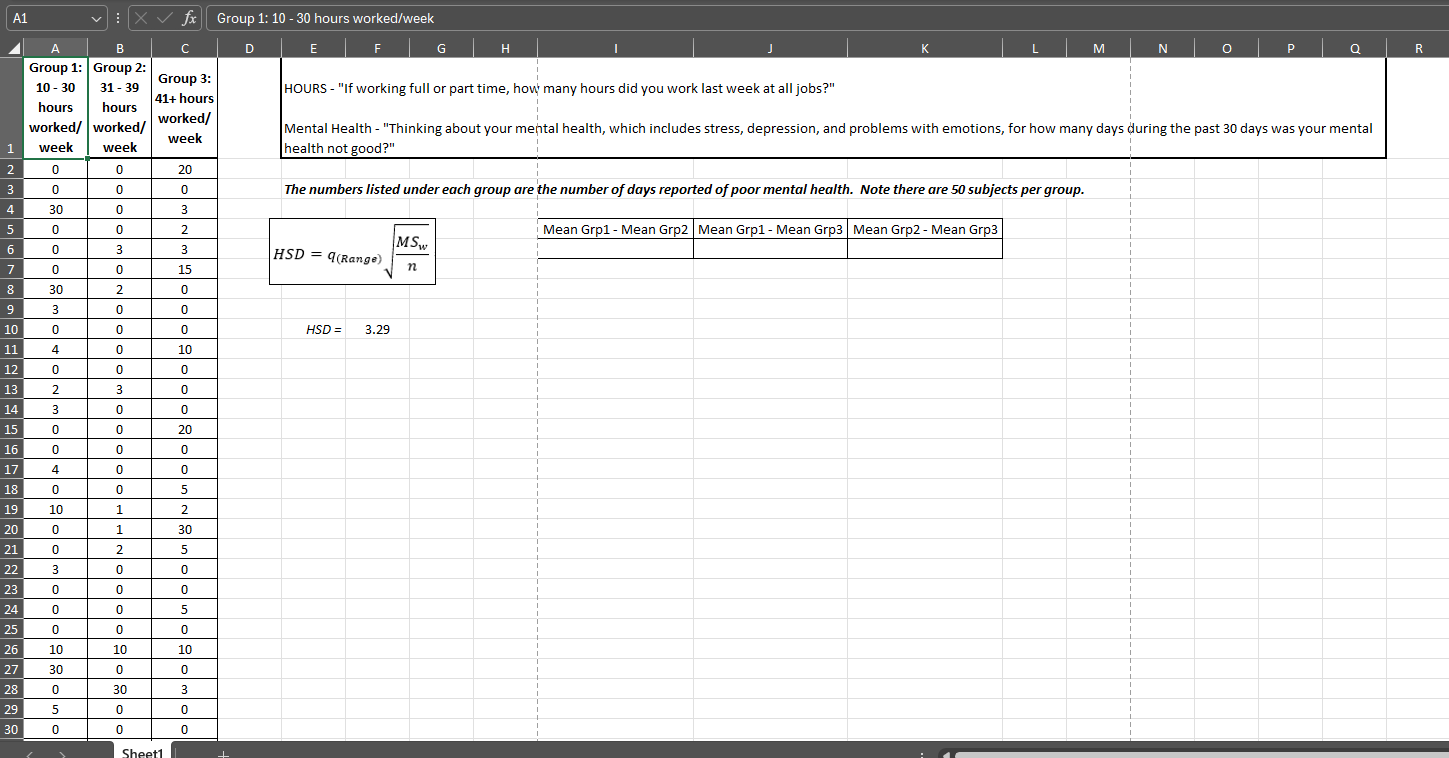
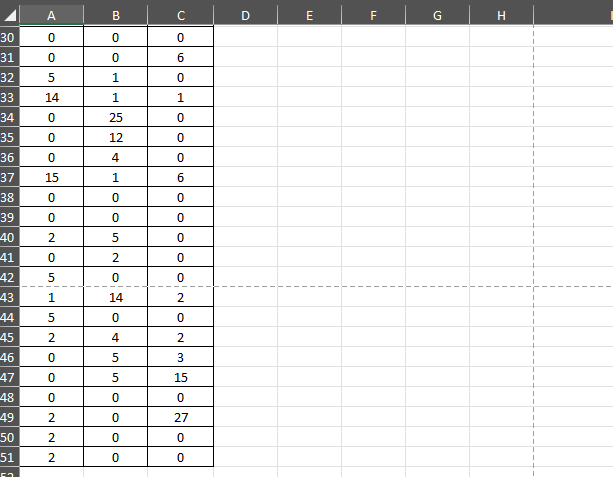
Due to formatting changes when copying over the ANOVA output, it's somewhat hard to read, but I am certain that you performed multiple one-way ANOVAs on each of the groups. The file I provided lists the GSS dataset variable of the number of hours worked - that is only one variable. Each of the three columns represents one of the groups of that lone variable. You are comparing the groups, thus they are all run using just one ANOVA, they aren't run separately.
The correct analysis would show that the F critical value of 3.057 with the F statistic of 0.519, which means there was not a significant relationship between mental health and the number of hours worked.
In the statistical analysis, you were to also calculate eta square and provide a graph of your data. You did not do either of these things. The grade assigned for this paper is only for the content of what was due for week 7's statistical analysis.
The discussion section is week 8's paper. You might want to rerun the calculations and rewrite the final discussion to reflect the correct analysis.
The primary variables from the GSS dataset used in this analysis are the hours worked per week and mental health status. The number of hours worked is categorized into three groups:
- Group 1: 10-30 hours worked per week
- Group 2: 31-39 hours worked per week
- Group 3: 41+ hours worked per week
Mental health status is measured through self-reported indicators of psychological well-being, specifically the number of days in the past 30 days when mental health was not good.
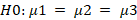
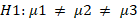
- Null Hypothesis (H0): There is no significant difference in mental health outcomes based on the number of hours worked.
- Alternative Hypothesis (H1): There is a significant difference in mental health outcomes based on the number of hours worked.
Symbolically, these hypotheses can be represented as:
Step by Step Solution
There are 3 Steps involved in it
Step: 1

Get Instant Access to Expert-Tailored Solutions
See step-by-step solutions with expert insights and AI powered tools for academic success
Step: 2

Step: 3
Ace Your Homework with AI
Get the answers you need in no time with our AI-driven, step-by-step assistance
Get Started
Calculus
Authors: Dale Varberg, Edwin J. Purcell, Steven E. Rigdon
9th edition
131429248, 978-0131429246