Question
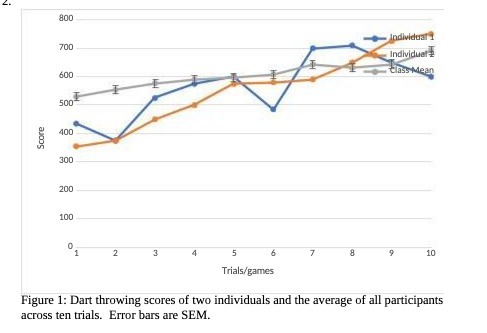
How do I get the line chart for individual 1 and 2 Score 800 700 600 500 400 300 200 100 2 3 5 6
How do I get the line chart for individual 1 and 2

Score 800 700 600 500 400 300 200 100 2 3 5 6 Trials/games 7 8 Individerat Individuat Class Mean 9 10 Figure 1: Dart throwing scores of two individuals and the average of all participants across ten trials. Error bars are SEM.
Step by Step Solution
There are 3 Steps involved in it
Step: 1

Get Instant Access to Expert-Tailored Solutions
See step-by-step solutions with expert insights and AI powered tools for academic success
Step: 2

Step: 3

Ace Your Homework with AI
Get the answers you need in no time with our AI-driven, step-by-step assistance
Get StartedRecommended Textbook for
Statistics For Business Decision Making And Analysis
Authors: Robert Stine, Dean Foster
2nd Edition
978-0321836519, 321836510, 978-0321890269
Students also viewed these Economics questions
Question
Answered: 1 week ago
Question
Answered: 1 week ago
Question
Answered: 1 week ago
Question
Answered: 1 week ago
Question
Answered: 1 week ago
Question
Answered: 1 week ago
Question
Answered: 1 week ago
Question
Answered: 1 week ago
Question
Answered: 1 week ago
Question
Answered: 1 week ago
Question
Answered: 1 week ago
Question
Answered: 1 week ago
Question
Answered: 1 week ago
Question
Answered: 1 week ago
Question
Answered: 1 week ago
Question
Answered: 1 week ago
Question
Answered: 1 week ago
Question
Answered: 1 week ago
Question
Answered: 1 week ago
Question
Answered: 1 week ago
Question
Answered: 1 week ago
Question
Answered: 1 week ago
View Answer in SolutionInn App


