how do I solve these statistics problems
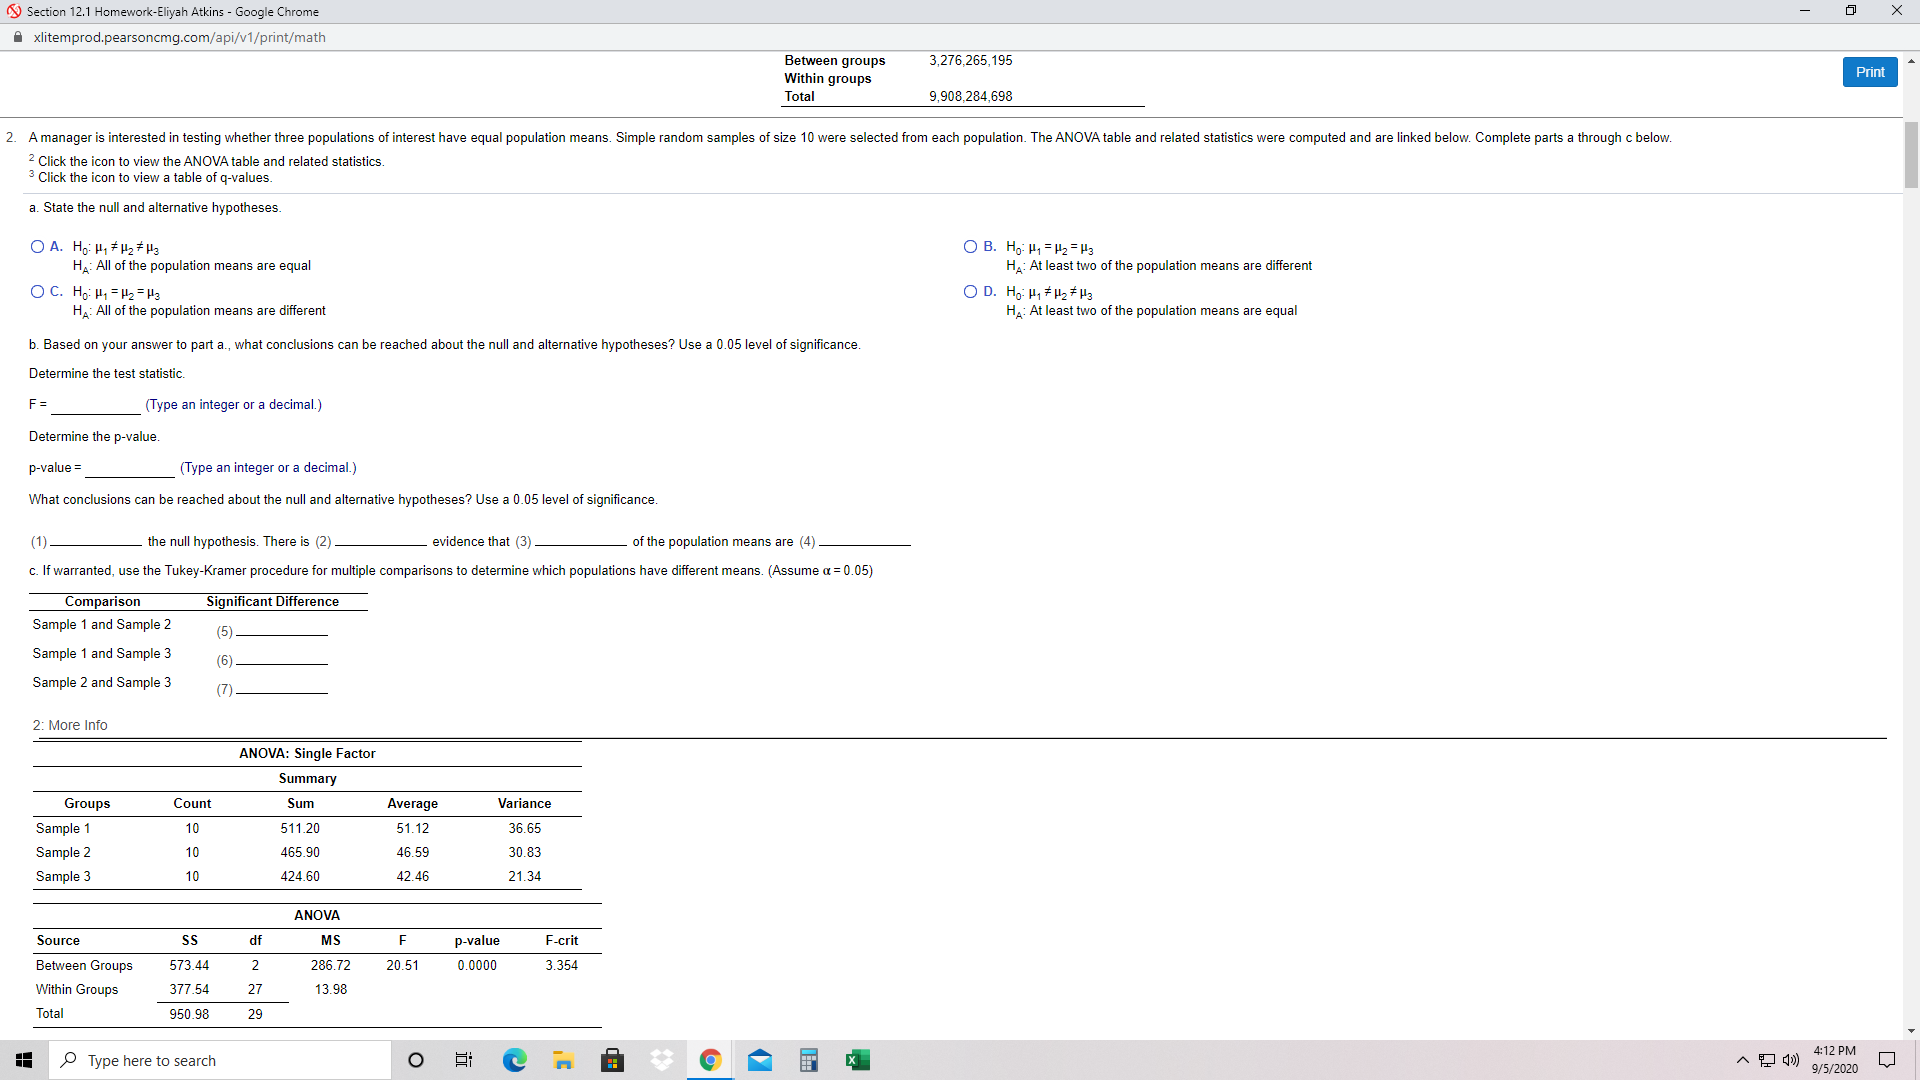
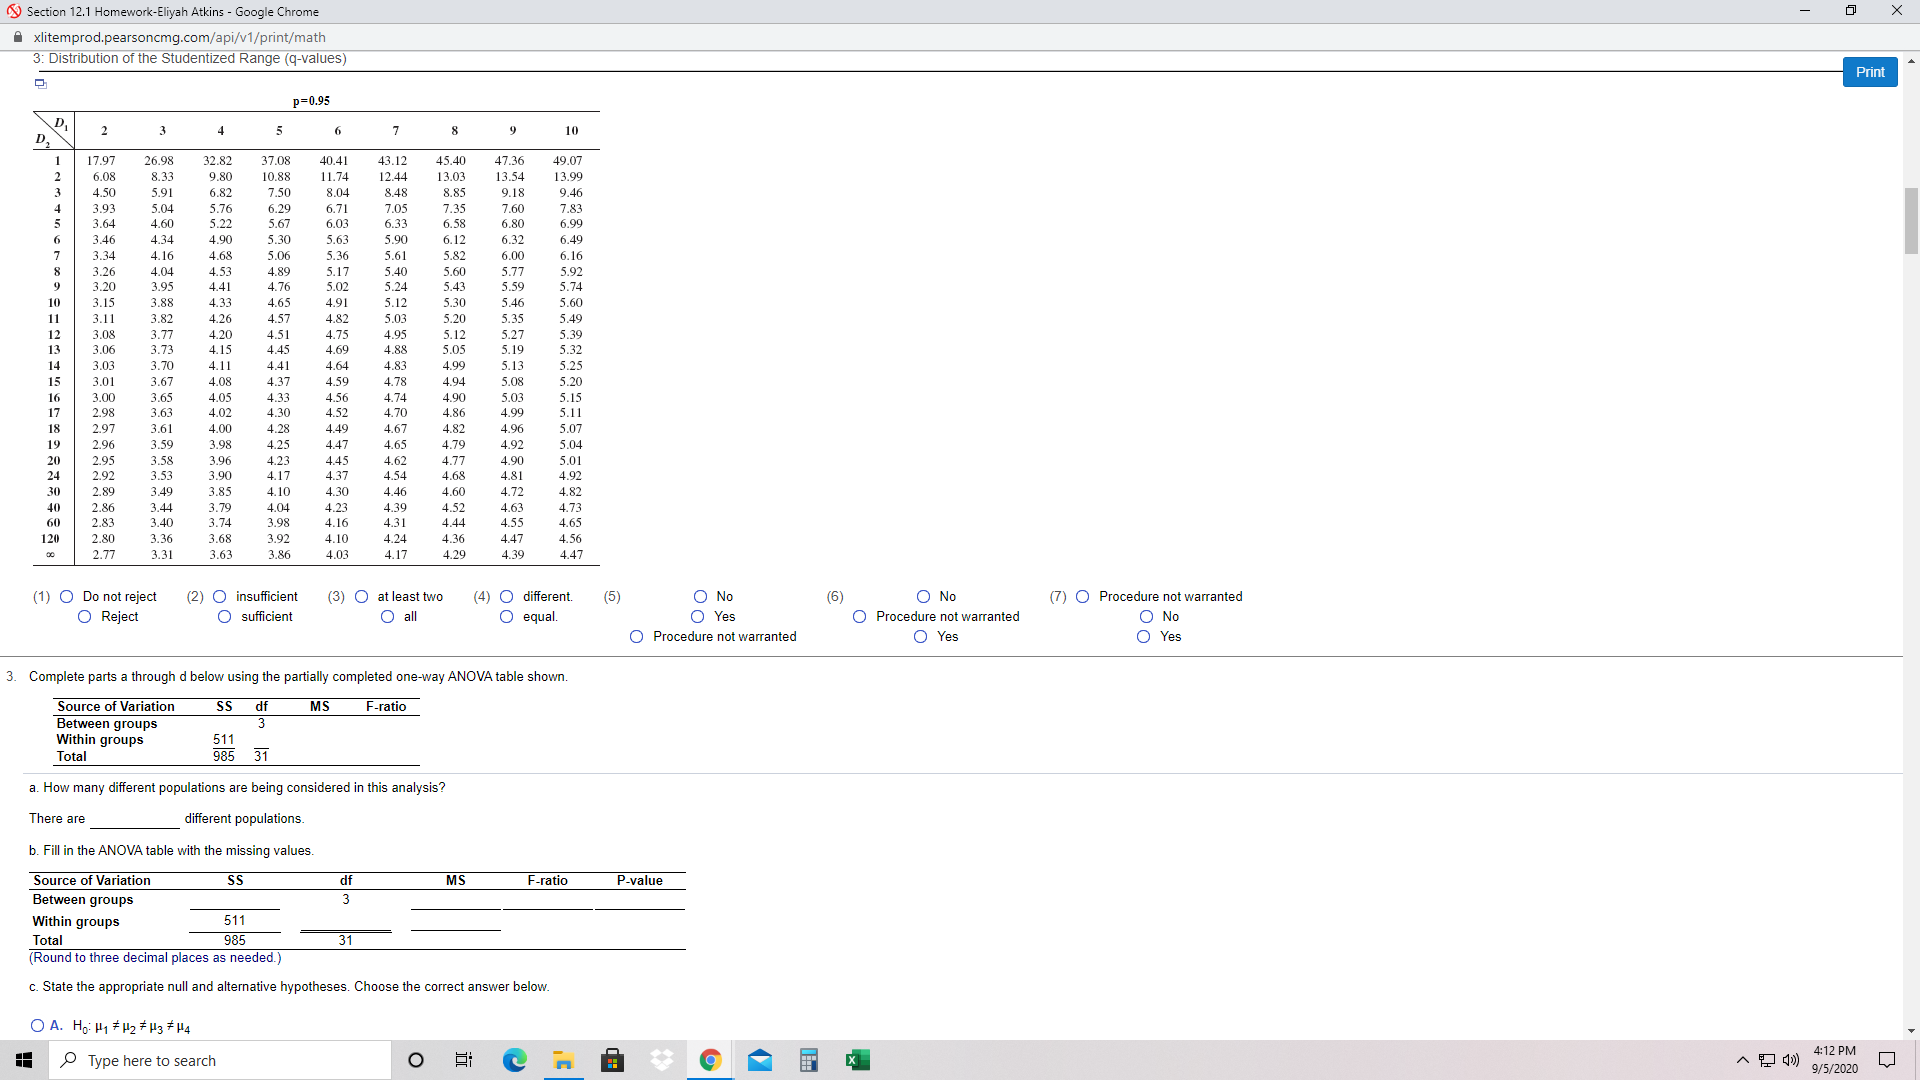
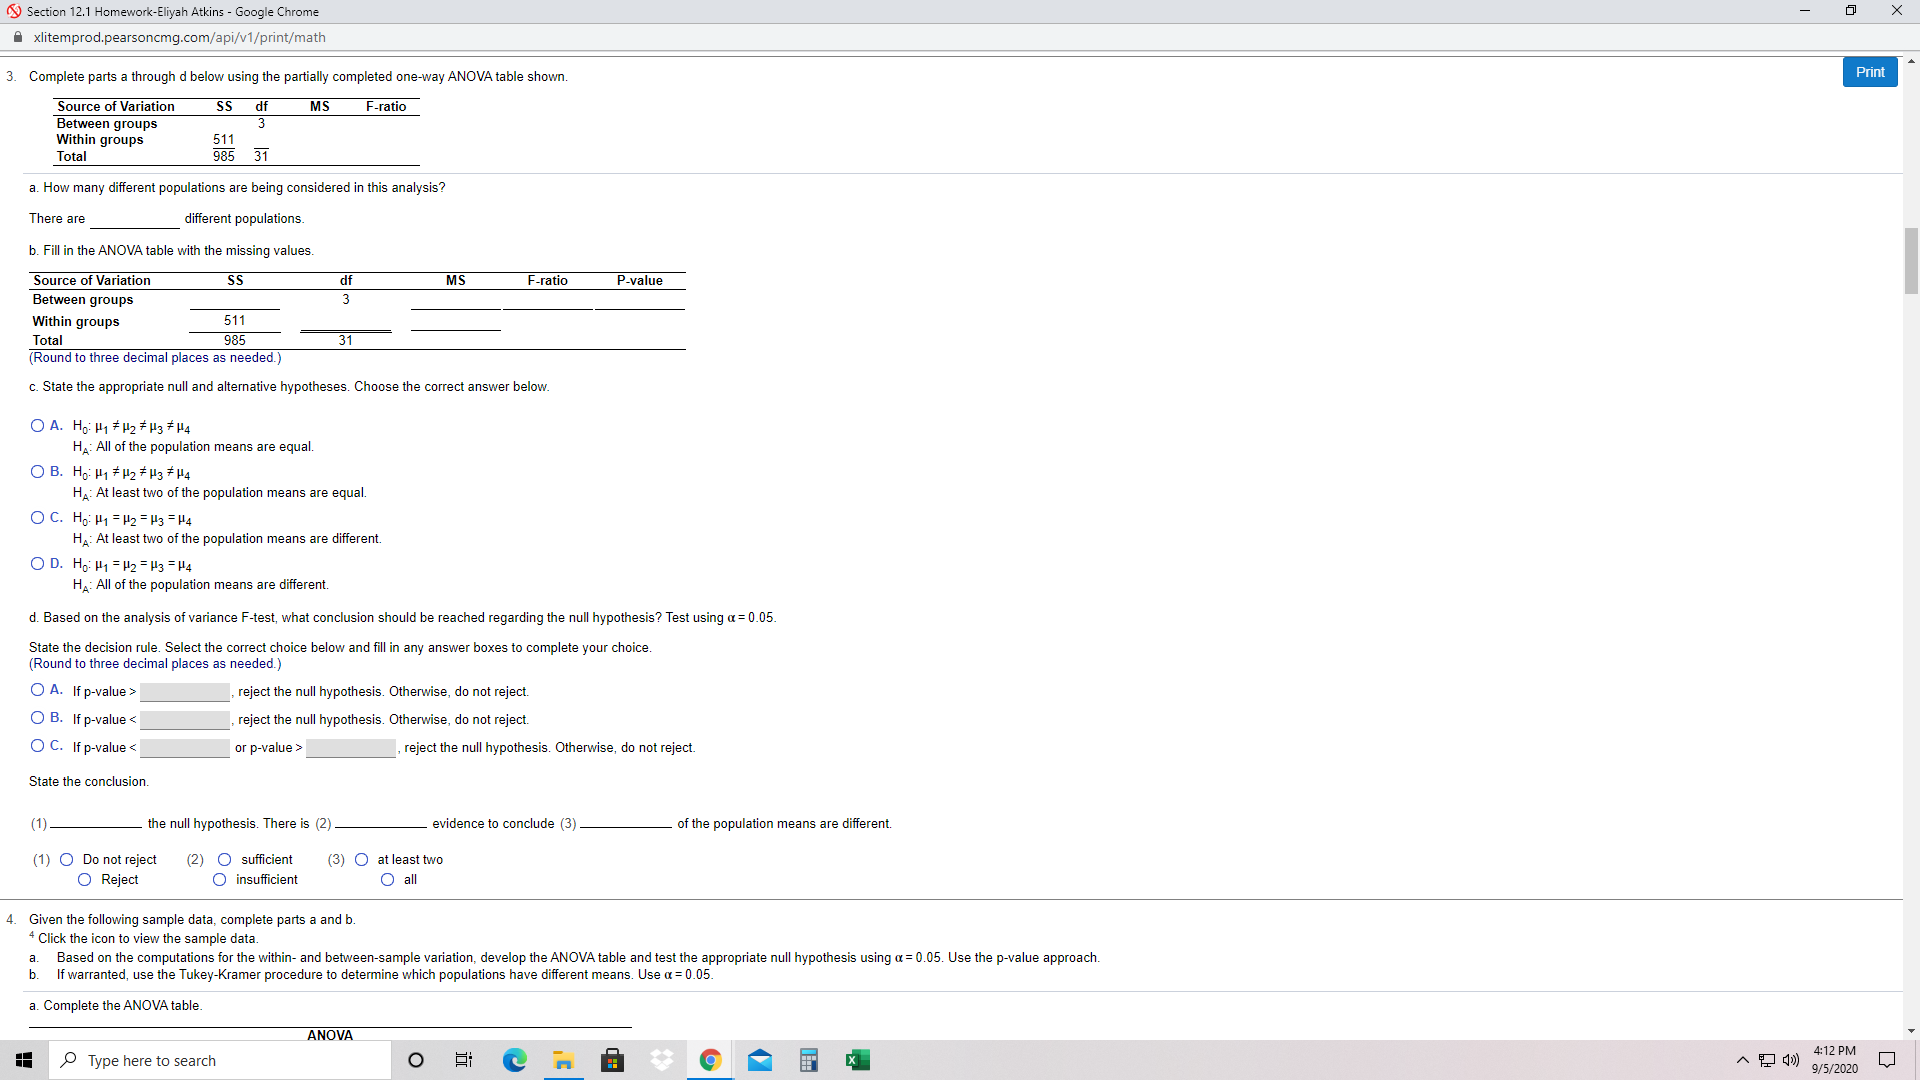
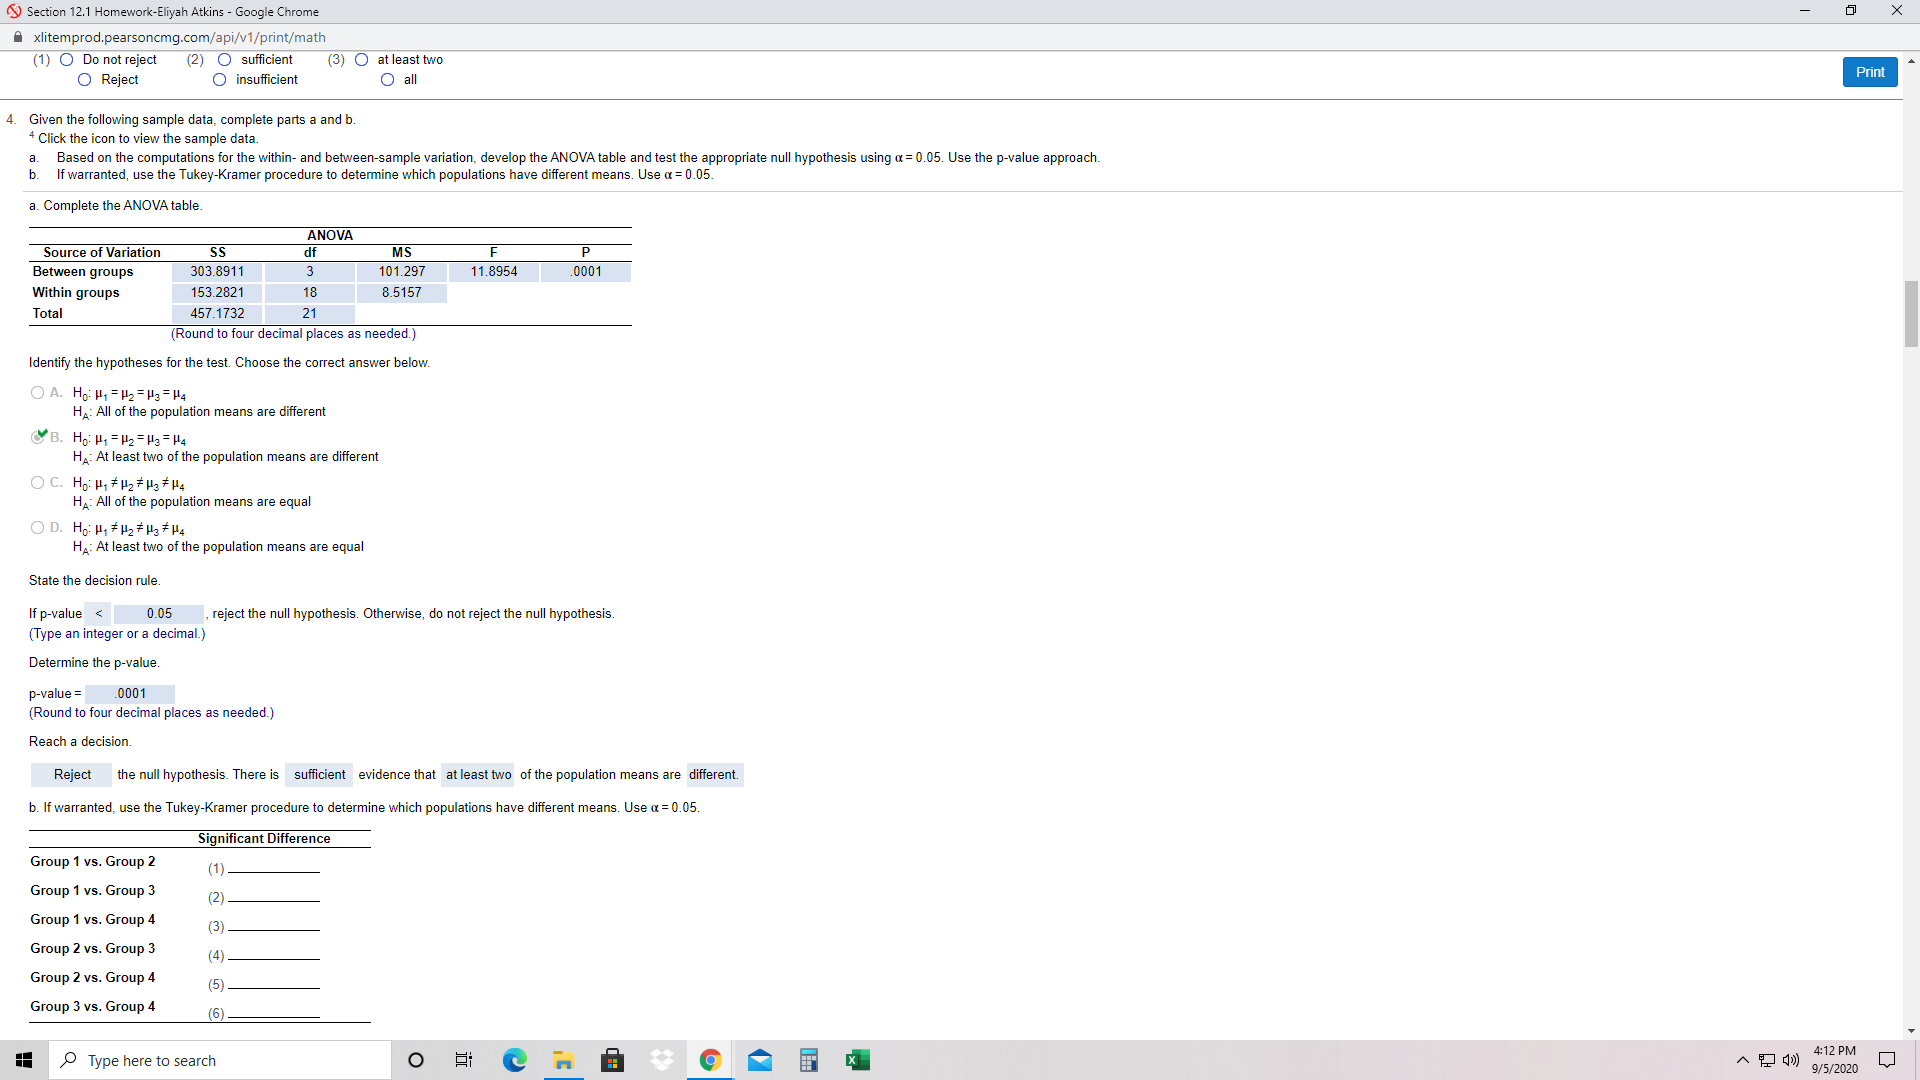
Section 12.1 Homework-Eliyah Atkins - Google Chrome X Axlitemprod.pearsoncmg.com/api/v1/print/math Between groups 3,276,265, 195 Within groups Print Tota 9,908,284,698 2. A manager is interested in testing whether three populations of interest have equal population means. Simple random samples of size 10 were selected from each population. The ANOVA table and related statistics were computed and are linked below. Complete parts a through c below. 2 Click the icon to view the ANOVA table and related statistics. 3 Click the icon to view a table of q-values. a. State the null and alternative hypotheses. OA. Ho: H, # H2 # Ha OB. Ho H, = H2 = H3 HA: All of the population means are equal HA: At least two of the population means are different O C. Ho: H, = H2 = H3 OD. Ho. H1 # H2# H3 HA: All of the population means are different HA: At least two of the population means are equal b. Based on your answer to part a., what conclusions can be reached about the null and alternative hypotheses? Use a 0.05 level of significance Determine the test statistic. F = (Type an integer or a decimal.) Determine the p-value p-value = (Type an integer or a decimal.) What conclusions can be reached about the null and alternative hypotheses? Use a 0.05 level of significance. (1) the null hypothesis. There is (2) - evidence that (3) - of the population means are (4) c. If warranted, use the Tukey-Kramer procedure for multiple comparisons to determine which populations have different means. (Assume a = 0.05) Comparison Significant Difference Sample 1 and Sample 2 (5 Sample 1 and Sample 3 (6 Sample 2 and Sample 3 (7) 2: More Info ANOVA: Single Factor Summary Groups Count Sum Average Variance Sample 1 10 511.20 51.1 36.65 Sample 2 10 465.90 46.59 30.83 Sample 3 10 424.60 42.46 21.34 ANOVA Source SS df MS p-value F-crit Between Groups 573.44 N 286.72 20.51 0.0000 3.354 Within Group 377.54 27 13.98 Total 950.98 29 4:12 PM Type here to search O 9/5/2020Section 12.1 Homework-Eliyah Atkins - Google Chrome X xlitemprod.pearsoncmg.com/api/v1/print/math 3: Distribution of the Studentized Range (q-values) Print P=0.95 2 5 7 8 10 17.97 26.98 32.82 $7.08 40.41 43.12 45.40 47.36 49.07 6.08 8.33 9.80 10.88 11.74 12.44 13.03 13.54 13.99 4.50 5.91 6.82 7.50 8.04 8.48 8.85 9.18 9.46 3.93 50 5.76 6.71 7.05 7.35 7.60 7.83 3.64 4.60 6.03 6.58 6.80 6.99 3.46 4.34 1.90 5.30 5.63 5.90 6.12 6.32 6.49 3.34 4.16 4.68 5.06 5.36 5.61 5.82 6.00 6.16 3.26 4.04 4. 53 4.89 5.17 5.40 5.60 5.77 5.92 3.95 4.41 4.76 5.74 10 3.15 3.88 4 33 4.65 4.91 5.30 5,46 5.60 3.11 3.82 4.26 4.57 4.82 5.03 5.20 5.35 5.49 12 3.08 3.77 4.20 4.51 4.75 4.95 5.12 5.27 5.39 13 3.06 3.73 4.15 4.45 4.69 4.88 5.05 5.19 5.32 14 3.03 4.11 4.64 199 5.13 5.25 15 3.01 3.70 4.08 4.59 16 4.78 4.94 5.08 5.20 3.00 3.65 4.05 4.33 4.56 4.74 4.90 5.03 17 5.15 2.98 3.63 4.02 4.30 4.52 4.70 4.86 4.99 5.11 18 2.97 3.61 4.00 4.28 4.49 4.67 4.82 4.96 5.07 19 4.47 4.65 4.79 4.92 5.04 20 2.96 3.59 3.98 24 2.95 4.23 4.45 4.62 4.77 4.90 5.01 2.92 3.53 3.90 4.17 4.37 4.54 4.68 4.81 4.92 30 2.89 3.49 3.85 4.10 4.30 4.46 4.60 4.72 4.82 40 60 2.86 3.44 3.79 4.04 4.23 4.39 4.52 4.63 4.73 2.83 3.40 3.74 3.98 4.16 4.55 2.80 4.31 4.44 4.65 120 3.36 3.68 3.92 4.10 4.36 4.47 4.56 2.77 3.31 3.63 3.86 4.03 4.29 4.39 4.47 (1) O Do not reject (2) O insufficient (3) O at least two (4) O different. (5) O No (6) O No (7) O Procedure not warranted O Reject O sufficient O all O equal. Yes O Procedure not warranted O Procedure not warranted Yes Yes 3. Complete parts a through d below using the partially completed one-way ANOVA table shown. Source of Variation SS df MS F-ratio Between groups Within groups 511 Total 985 31 a. How many different populations are being considered in this analysis? There are different populations. b. Fill in the ANOVA table with the missing values Source of Variation SS df MS F-ratio P-value Between groups Within groups 511 Total 985 31 (Round to three decimal places as needed. c. State the appropriate null and alternative hypotheses. Choose the correct answer below. OA. Ho. H1 # H2 # H3 # H4 Type here to search O 9/5/2020Section 12.1 Homework-Eliyah Atkins - Google Chrome X Axlitemprod.pearsoncmg.com/api/v1/print/math 3. Complete parts a through d below using the partially completed one-way ANOVA table shown. Print Source of Variation SS df MS F-ratio Between groups Within groups 511 Total 985 31 a. How many different populations are being considered in this analysis? There are different populations. b. Fill in the ANOVA table with the missing values Source of Variation SS df 3 MS F-ratio P-value Between groups Within groups 51 Total 985 31 (Round to three decimal places as needed.) c. State the appropriate null and alternative hypotheses. Choose the correct answer below. OA. Ho. H1 # H2 # H3 # H4 HA: All of the population means are equal. OB. Ho: H1 # H2 # H3 # HA HA: At least two of the population means are equal. O C. Ho: H1 = H2 = H3 = H4 HA: At least two of the population means are different. OD. Ho: H1 = H2 = H3 = H4 HA: All of the population means are different. d. Based on the analysis of variance F-test, what conclusion should be reached regarding the null hypothesis? Test using a = 0.05. State the decision rule. Select the correct choice below and fill in any answer boxes to complete your choice. (Round to three decimal places as needed.) O A. If p-value > reject the null hypothesis. Otherwise, do not reject. O B. If p-value . reject the null hypothesis. Otherwise, do not reject. State the conclusion. (1) the null hypothesis. There is (2) evidence to conclude (3) of the population means are different. (1) O Do not reject (2) O sufficient (3) O at least two Reject O insufficient O all 4. Given the following sample data, complete parts a and b. 4 Click the icon to view the sample data. a. Based on the computations for the within- and between-sample variation, develop the ANOVA table and test the appropriate null hypothesis using o = 0.05. Use the p-value approach. b. If warranted, use the Tukey-Kramer procedure to determine which populations have different means. Use a = 0.05 a. Complete the ANOVA table. ANOVA Type here to search O X 4:12 PM 9/5/2020Section 12.1 Homework-Eliyah Atkins - Google Chrome X xlitemprod.pearsoncmg.com/api/v1/print/math (1) O Do not reject (2) O sufficient (3) O at least two Reject O insufficient O all Print 4. Given the following sample data, complete parts a and b. 4 Click the icon to view the sample data. a. Based on the computations for the within- and between-sample variation, develop the ANOVA table and test the appropriate null hypothesis using o = 0.05. Use the p-value approach. b. If warranted, use the Tukey-Kramer procedure to determine which populations have different means. Use a = 0.05. . Complete the ANOVA table. ANOVA Source of Variation SS df MS P Between groups 303.8911 3 101.297 11.8954 .0001 Within groups 153.2821 18 8.5157 Total 457.1732 21 (Round to four decimal places as needed.) Identify the hypotheses for the test. Choose the correct answer below. OA. Ho: H1 = H2 = H3 = H4 HA: All of the population means are different B. Ho: H1 = H2 = H3 = H4 HA: At least two of the population means are different O C. Ho: H, # H2 # Hg # H4 HA: All of the population means are equal OD. Ho: H, # H2 # H3 # H4 HA: At least two of the population means are equal State the decision rule If p-value