Question
How do marketing campaigns influence customers' perception of a product? Organizations often collect customer data to help answer this question. For example, a University in
How do marketing campaigns influence customers' perception of a product? Organizations often collect customer data to help answer this question. For example, a University in Boston is concerned with the satisfaction of students in their flagship MBA course, that is, their MBA in Analytics. They collected data on student satisfaction earlier this year and considered different options to improve satisfaction.
The University considered two options. Option 1: increase the quality of the MBA course by hiring three nationally recognized professors and revising the curriculum. This would require a significant investment. Option 2: keep the course as is (i.e., no new professors or curriculum revision) but instead create a marketing campaign to enhance the perception of students regarding the benefits and quality of the course. The goal of this campaign is to emphasize the amazing career opportunities in analytics and how the MBA will help students benefit from those opportunities.
The University decided to go with Option 2. Their hypothesis was simple: the marketing campaign would improve the satisfaction of MBA students despite the fact that no changes or improvements were made to the MBA course. This is a fascinating strategy: there's no need to improve the product. Instead, let's change the customers' perception of the product.
The university is finishing a new round of data collection, which will allow them to test this hypothesis soon. Complete the following tasks:
- Do you believe the data will support this hypothesis? In your post, present TWO reasons to justify why you believe the hypothesis will hold or not hold. Your answer should be at least 100 words long, and include at least one reference (e.g., an online article, study, etc.) to support your argument.
- Reply to one of the other posts. Indicate if you agree with the arguments presented or if you learned something new from the other post.
THIS BOTTOM PART IS WHAT NEED TO BE COMPLETED NOT ABOVE THAT'S JUST EXTRA INFORMATION
MBA Student Satisfaction Excel Challenge
NOTE 1: Before completing this assignment, you must reply to the Discussion "MBA Student Satisfaction Case".
NOTE 2: In Excel Challenge 6, you learned how to do a t-Test (Two-Sample Assuming Equal Variances). A different type of t-Test, referred to as Paired Two Sample for Means, can be used to compare Before and After results (as in the MBA student satisfaction case). The logic of the test and interpretation of p-values are the same. For example, you can examine if the blood pressure of 100 patients went down after a treatment. In this case, you need blood pressure data for these 100 patients before and after the treatment. A t-Test: Paired Two Sample for Means can be used to test if blood pressure was reduced significantly. For an example of how to perform this test in Excel to compare results before and after a treatment, see the short video below:
Introduction and Data
As explained in the "MBA Student Satisfaction Case" discussion, the University in Boston is concerned with the satisfaction of students in their flagship MBA course, i.e., their MBA in Analytics. They collected data on student satisfaction before and after running a marketing campaign. The purpose of the marketing campaign was to enhance the perception of students regarding the benefits and quality of the MBA course, in particular, by emphasizing the amazing career opportunities in analytics and how the MBA would help.
Their hypothesis was simple: the marketing campaign would improve the satisfaction of MBA students despite the fact that no changes or improvements were made to the MBA course. The data is available here Download data is available herea nd you can now test this hypothesis.
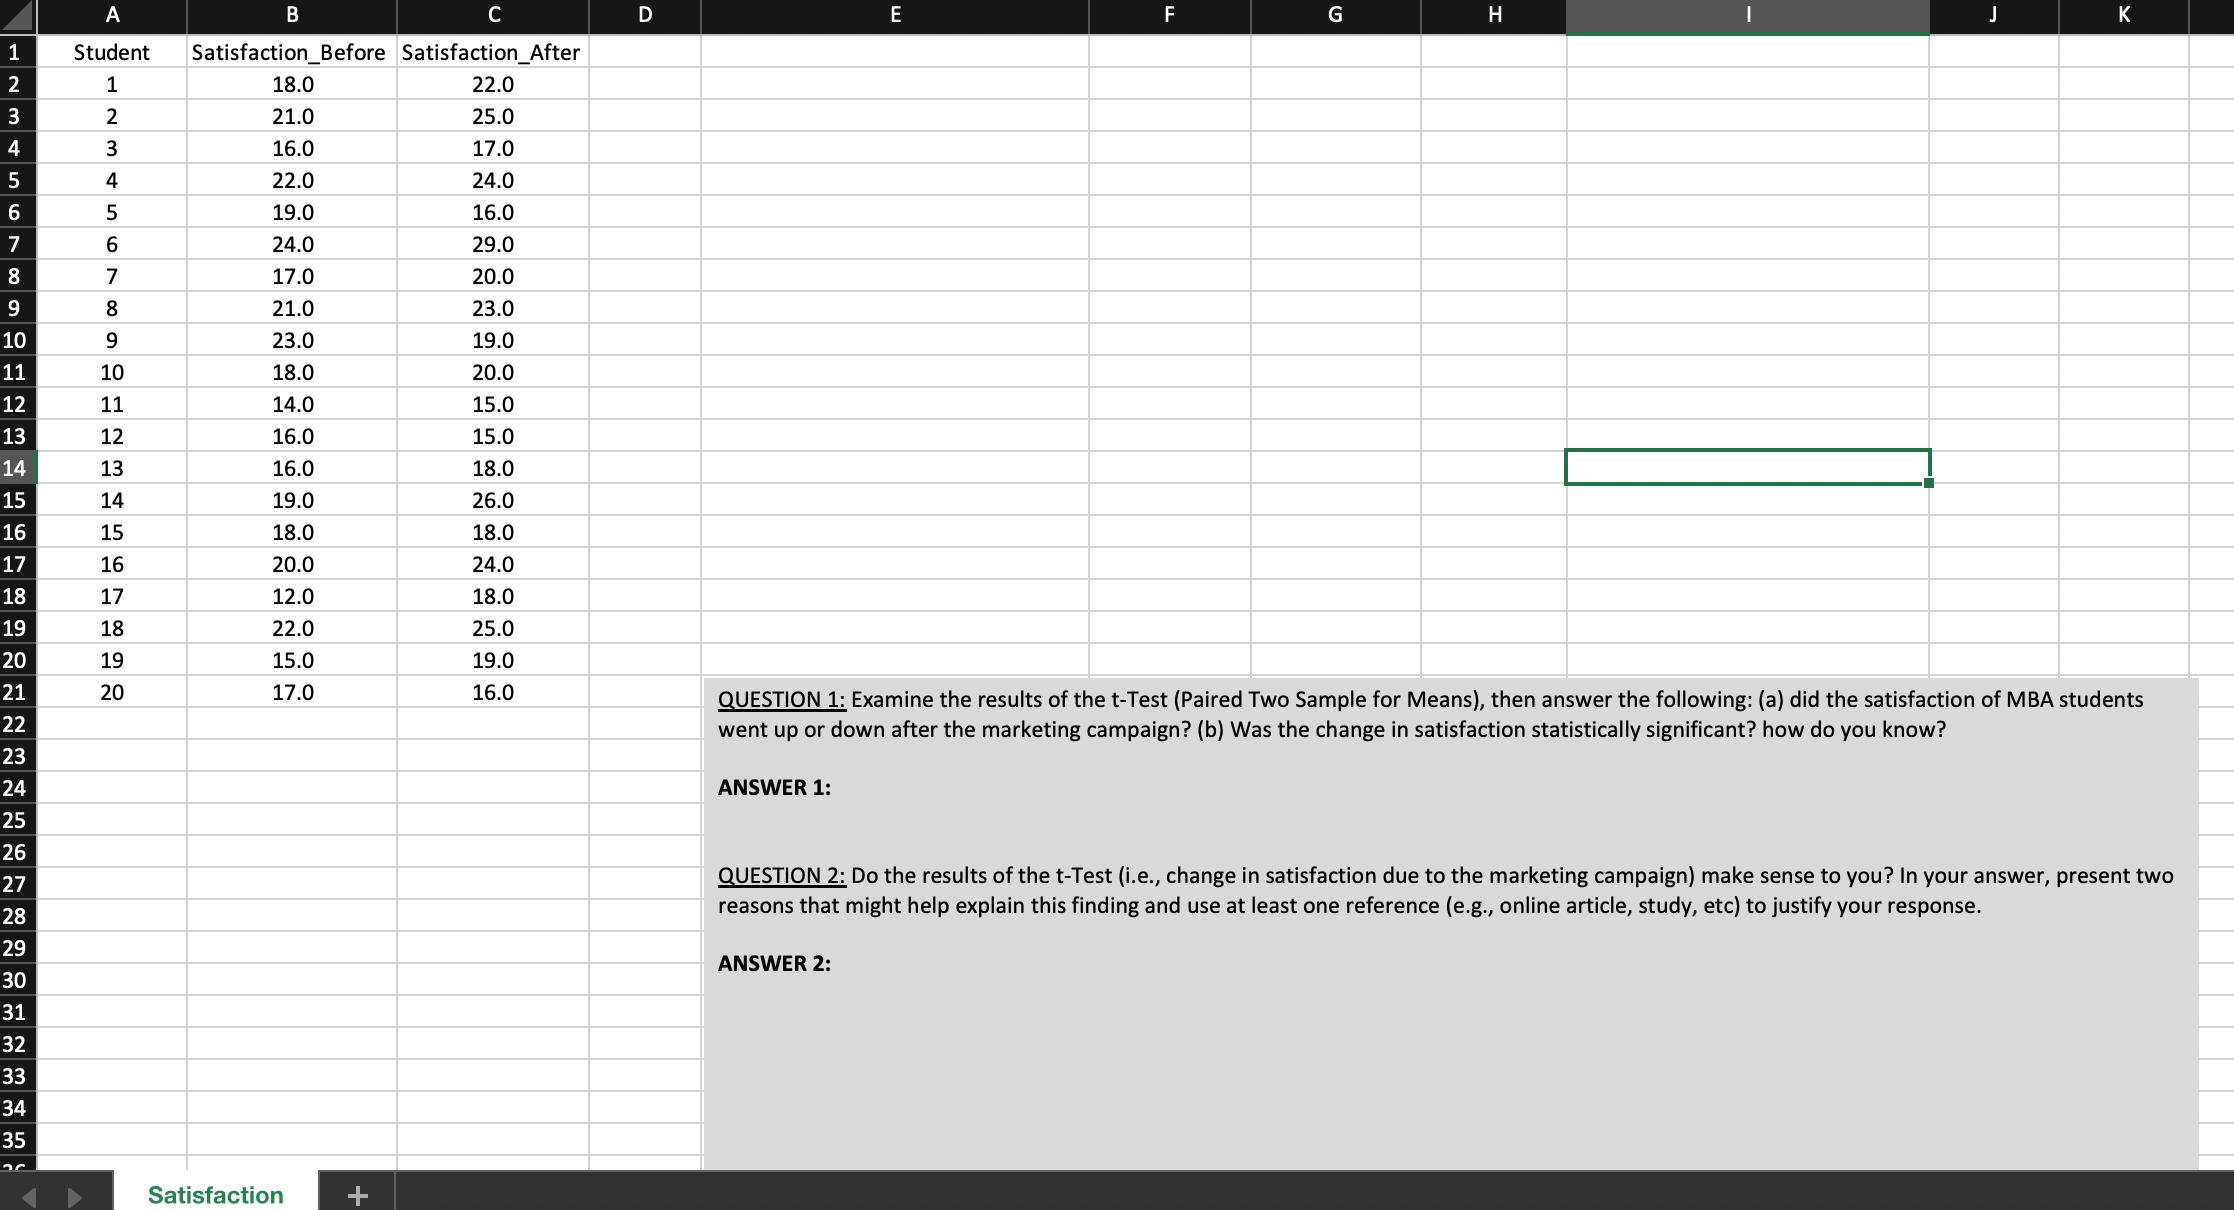
TASK 1: Perform a t-Test analysis (Paired Two Sample for Means) to compare the satisfaction of MBA students before and after the marketing campaign. In the t-Test parameter window, select "Output Range" as the output option. Then select Cell E2 as the output range. Examine the results of the t-Test and then answer the following in the Text Box presented in the Excel file: QUESTION 1: (a) did the satisfaction of MBA students went up or down after the marketing campaign? (b) Was the change in satisfaction statistically significant? how do you know?
TASK 2: Answer the following question in the Text Box presented in the Excel file: QUESTION 2: Do the results of the t-Test (i.e., change in satisfaction due to the marketing campaign) make sense to you? In your answer, present two reasons that might help explain this finding and use at least one reference (e.g., online article, study, etc) to justify your response.
- The answer to this question should be based on your post to the MBA Student Satisfaction Case Discussion.

A B C D E F G H K 1 Student Satisfaction_Before Satisfaction_After 2 1 18.0 22.0 3 2 21.0 25.0 4 3 16.0 17.0 5 4 22.0 24.0 6 5 19.0 16.0 7 6 24.0 29.0 8 7 17.0 20.0 9 8 21.0 23.0 10 9 23.0 19.0 11 10 18.0 20.0 12 11 14.0 15.0 13 12 16.0 15.0 14 13 16.0 18.0 15 14 19.0 26.0 16 15 18.0 18.0 17 16 20.0 24.0 18 17 12.0 18.0 19 18 22.0 25.0 20 19 15.0 19.0 21 20 17.0 16.0 22 23 24 QUESTION 1: Examine the results of the t-Test (Paired Two Sample for Means), then answer the following: (a) did the satisfaction of MBA students went up or down after the marketing campaign? (b) Was the change in satisfaction statistically significant? how do you know? ANSWER 1: 25 26 27 28 29 QUESTION 2: Do the results of the t-Test (i.e., change in satisfaction due to the marketing campaign) make sense to you? In your answer, present two reasons that might help explain this finding and use at least one reference (e.g., online article, study, etc) to justify your response. ANSWER 2: 30 31 32 33 34 35 Satisfaction +
Step by Step Solution
There are 3 Steps involved in it
Step: 1

Get Instant Access to Expert-Tailored Solutions
See step-by-step solutions with expert insights and AI powered tools for academic success
Step: 2

Step: 3

Ace Your Homework with AI
Get the answers you need in no time with our AI-driven, step-by-step assistance
Get Started


