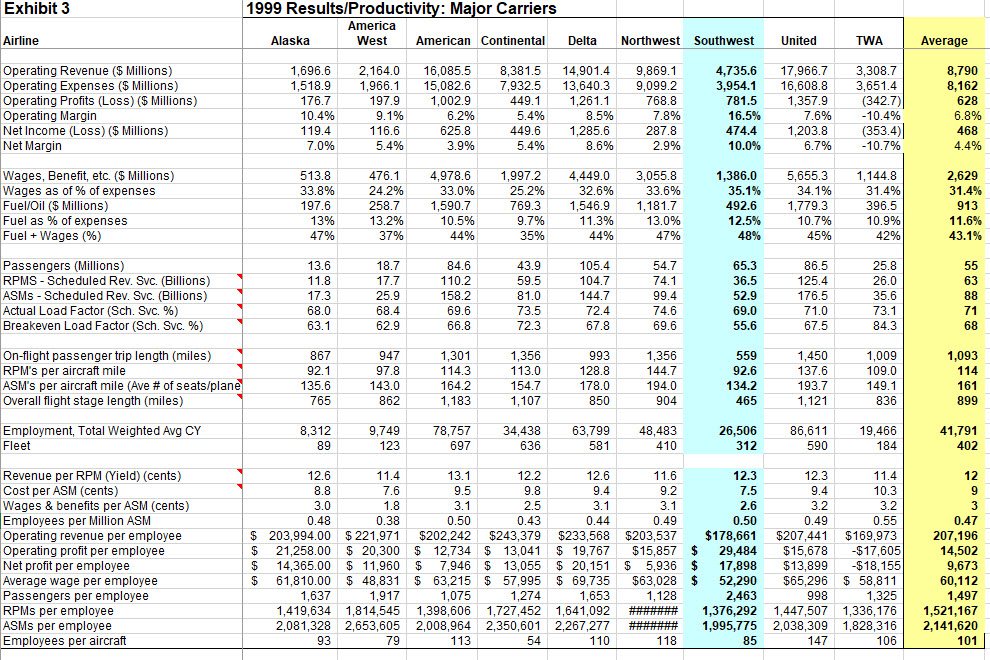
How does Southwest's revenue per RPM and cost per ASM in Exhibit 3 compare with the industry average and what factors may explain Southwest's numbers relative to its peers?
Exhibit 3 1999 Results/Productivity: Major Carriers America Airline Alaska West American Continental Delta Northwest Southwest United TWA Average Operating Revenue ($ Millions 1,696.6 2,164.0 16,085.5 8,381.5 14,901.4 9,869.1 4,735.6 17,966.7 3,308.7 8,790 Operating Expenses ($ Millions) 1,518.9 1,966.1 15,082.6 7,932.5 13,640.3 9,099.2 3,954.1 16,608.8 3,651.4 8.162 Operating Profits (Loss) ($ Millions) 176.7 197.9 1,002.9 449.1 1,261.1 768.8 781.5 1,357.9 (342.7) 628 Operating Margin 10.4% 9.1% 6.2% 5.4% 8.5% 7.8% 16.5% 7.6% -10.4% 6.8% Net Income (Loss) ($ Millions) 119.4 116.6 625.8 449.6 1,285.6 287.8 474.4 1,203.8 (353.4) 468 Net Margin 7.0% 5.4% 3.9% 5.4% 8.6% 2.9% 10.0% 6.7% -10.7% 4.4% Wages, Benefit, etc. ($ Millions) 513.8 476.1 4,978.6 1,997.2 4,449.0 3,055.8 1,386.0 5,655.3 1,144.8 2,629 Wages as of % of expenses 33.8% 24.2% 33.0% 25.2% 32.6% 33.6% 35.1% 34.1% 31.4% 31.4% Fuel/Oil ($ Millions) 197.6 258.7 1,590.7 769.3 1,546.9 1, 181.7 492.6 1,779.3 396.5 913 Fuel as % of expenses 13% 13.2% 10.5% 9.7% 11.3% 13.0% 12.5% 10.7% 10.9% 11.6% Fuel + Wages (%) 47% 37% 44% 35% 44% 47% 48% 45% 42% 43.1% Passengers (Millions) 13.6 18.7 84.6 43.9 105.4 54.7 65.3 86.5 25.8 55 RPMS - Scheduled Rev. Svc. (Billions) 11.8 17.7 110.2 59.5 104.7 74.1 36.5 125.4 26.0 63 ASMs - Scheduled Rev. Svc. (Billions) 17.3 25.9 158.2 81.0 144.7 99.4 52.9 176.5 35.6 88 Actual Load Factor (Sch. Svc. %) 68.0 68.4 69.6 73.5 72.4 74.6 69.0 71.0 73.1 71 Breakeven Load Factor (Sch. Svc. %) 63.1 62.9 66 8 72.3 67.8 69.6 55.6 67.5 84.3 68 On-flight passenger trip length (miles) 867 947 1,301 1,356 993 1,356 559 1,450 1,009 1,093 RPM's per aircraft mile 92.1 97.8 114.3 113.0 128.8 144.7 92.6 137.6 109.0 114 ASM's per aircraft mile (Ave # of seats/plane) 135.6 143.0 164.2 154.7 178.0 194.0 134.2 193.7 149.1 161 Overall flight stage length (miles) 765 862 1,183 1,107 850 904 465 1, 121 836 899 Employment, Total Weighted Avg CY 8,312 9,749 78,757 34,438 63,799 48,483 26,506 86,611 19,466 41,791 Fleet 89 123 697 636 581 410 312 590 184 402 Revenue per RPM (Yield) (cents) 12.6 11.4 13.1 12.2 12.6 11.6 12.3 12.3 11.4 12 Cost per ASM (cents) 8.8 7.6 9.5 9.8 9.4 9.2 7.5 9.4 10.3 Wages & benefits per ASM (cents) 3.0 1.8 3.1 2.5 3.1 3.1 2.6 3.2 3.2 Employees per Million ASM 0.48 0.38 0.50 0.43 0.44 0.49 0.50 0.49 0.55 0.47 Operating revenue per employee $ 203,994.00 $ 221,971 $202,242 $243,379 $233,568 $203,537 $178,661 $207,441 $169,973 207,196 Operating profit per employee 21,258.00 $ 20,300 $ 12,734 $ 13,041 $ 19,767 $15,857 $ 29,484 $15,678 -$17,605 14,502 Net profit per employee $ 14,365.00 $ 11,960 7,946 $ 13,055 $ 20,151 $ 5,936 17,898 $13,899 -$18, 155 9,673 Average wage per employee 61,810.00 $ 48,831 63,215 $ 57,995 $ 69,735 $63,028 52,290 $65,296 $ 58,811 60,112 Passengers per employee 1,637 1,917 1,075 1,274 1,653 1,128 2,463 998 1,325 1,497 RPMs per employee 1,419,634 1,814,545 1,398,606 1,727,452 1,641,092 1,376,292 1,447,507 1,336, 176 1,521,167 ASMs per employee 2,081,328 2,653,605 2,008,964 2,350,601 2,267,277 1,995,775 2,038,309 1,828,316 2,141,620 Employees per aircraft 93 79 113 54 110 118 85 147 106 101


