

Question
how to add lag times and correct duration in Microsoft project? this is the information given on the red Zuma project. Top management is not
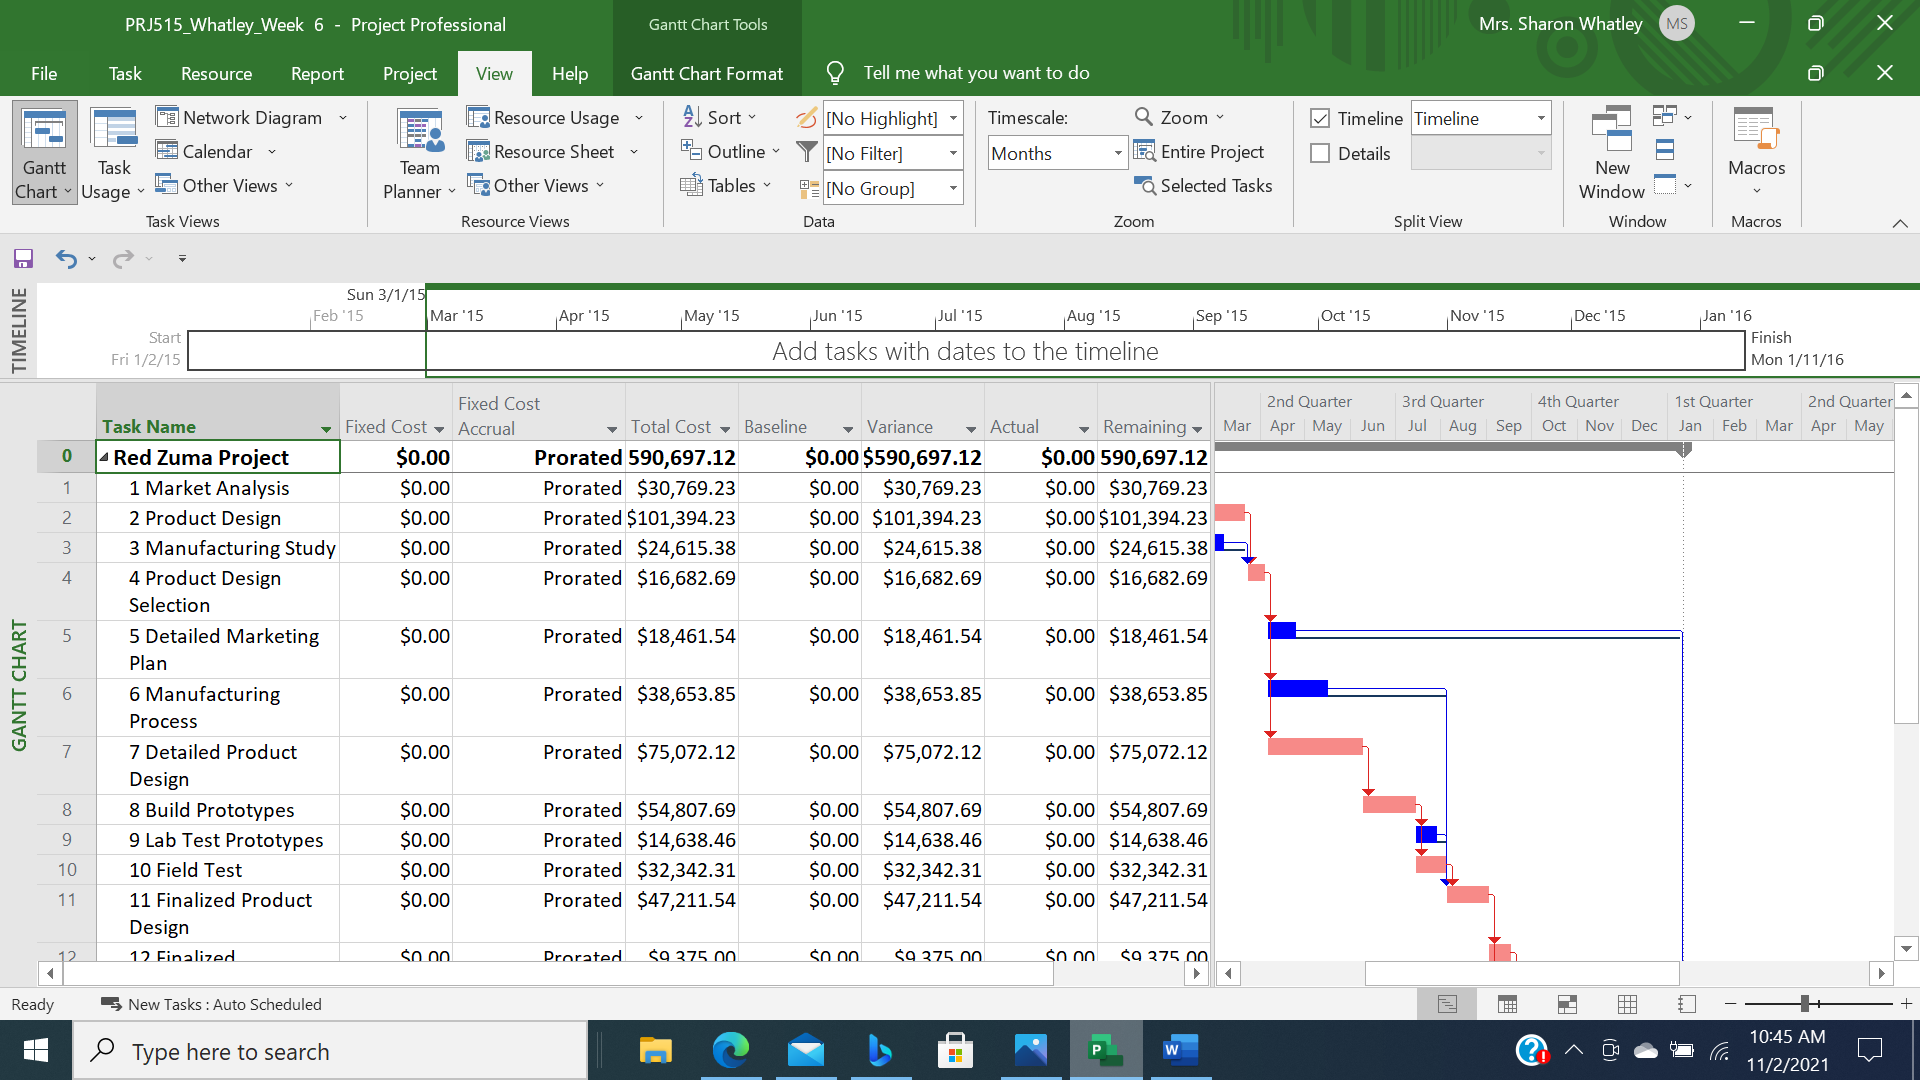
how to add lag times and correct duration in Microsoft project? this is the information given on the red Zuma project. Top management is not happy with the resource-constrained schedule. Robin Lane, the president, has promised retailers that ARC will begin production in time for the major trade show in Las Vegas on January 22, 2016, which means the project needs to be completed by January 17, 2016. She has authorized working the first available Saturday of each month to help the project get completed sooner. She realizes that this will only reduce the project duration by 12-13 days.
After talking to the engineers, everyone agrees that they do not have to wait for the Detailed Product Design to be 100% completed before starting to build the prototype. The consensus is that Building the Prototype can start 30 days after the start of the Detailed Product Design. Likewise the Final Manufacturing Process can start 15 days after the start of Finalized Product Design.
Step by Step Solution
There are 3 Steps involved in it
Step: 1

Get Instant Access to Expert-Tailored Solutions
See step-by-step solutions with expert insights and AI powered tools for academic success
Step: 2

Step: 3
Ace Your Homework with AI
Get the answers you need in no time with our AI-driven, step-by-step assistance
Get Started
Operations Management Creating Value Along the Supply Chain
Authors: Roberta S. Russell, Bernard W. Taylor
7th Edition
9781118139523, 0470525908, 1118139526, 978-0470525906