 How to calculate: Current Ratio/Quick Ratio/Inventory Turnover Ratio /DSO /Fixed Asset Turnover Ratio /Total Asset Turnover Ratio /Total Debt to Total Capital /Times-Interest-Earned Ratio /Operating Margin (Use Operating Income after Depreciation/EBIT) /Net Profit Margin/Profit Margin /Return on Total Assets /Return on Common Equity /Return on Invested Capital /Basic Earning Power Ratio / Price-Earnings Ratio /Market to Book Value
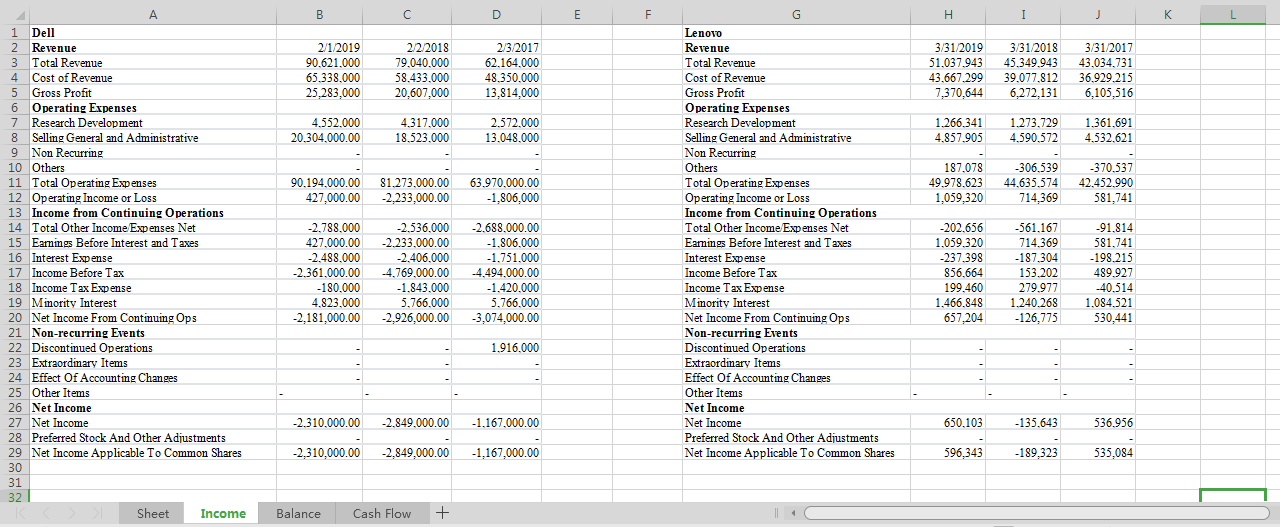
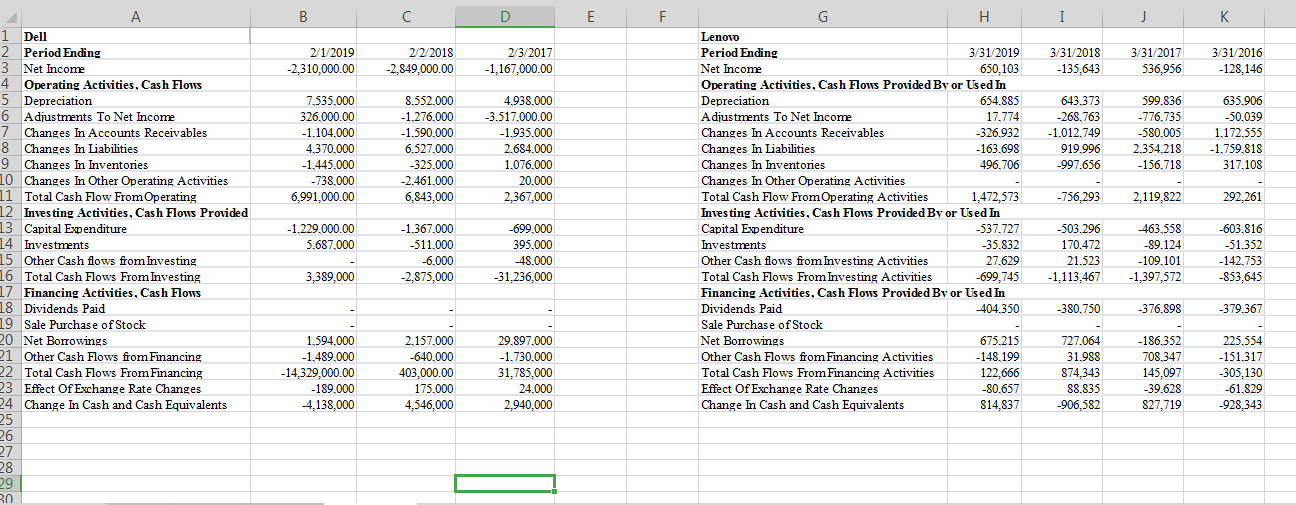
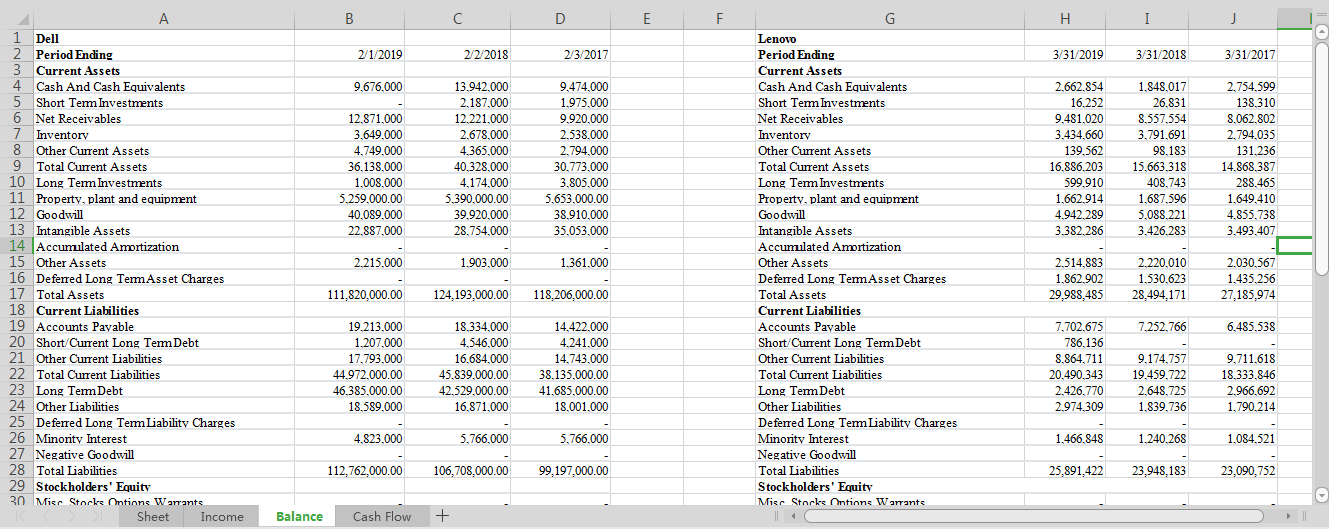
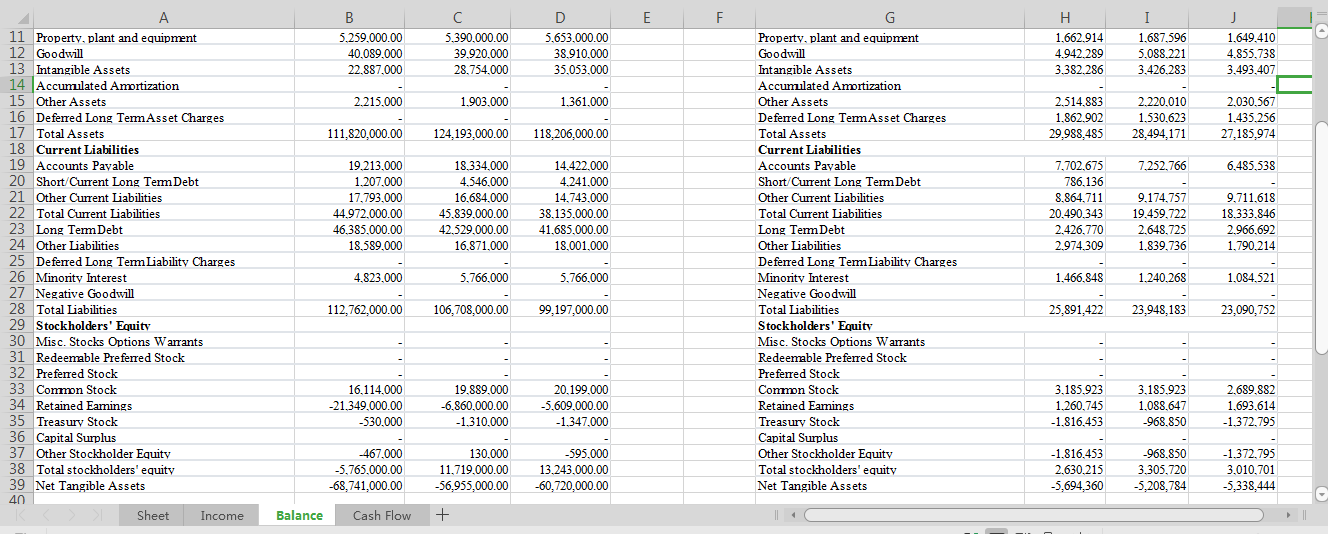
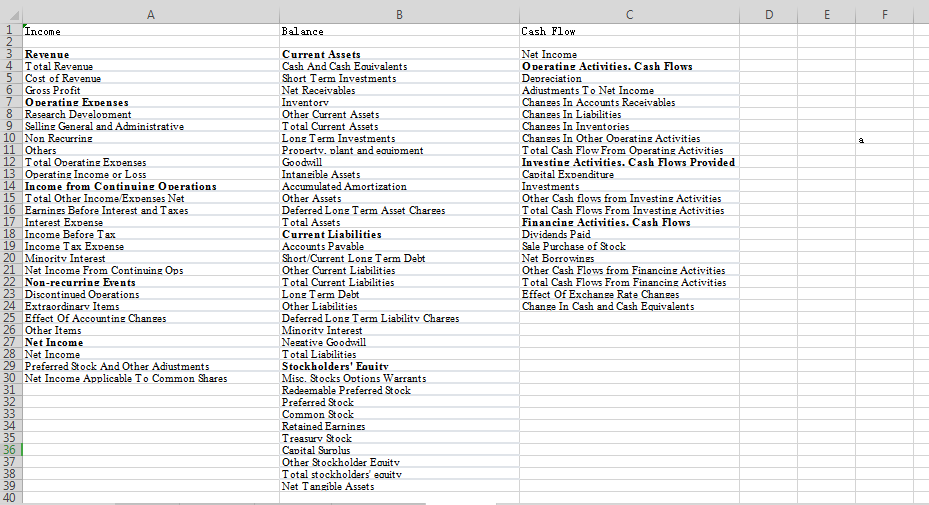
data from the picture
H I J K 2/1/2019 90.621.000 65.338.000 25,283,000 222018 79,040,000 58.433.000 20,607,000 2/3/2017 62.164.000 48.350.000 13,814,000 3/31/2019 51,037.943 43.667.299 7,370,644 3/31/2018 45.349.943 39.077.812 6,272,131 3/31/2017 43,034.731 36.929.215 6,105,516 4.552.000 20.304,000.00 4.317,000 18.523.000 2.572.000 13.048.000 1.266.341 4.857.905 1.273.729 4.590.572 1.361.691 4.532.621 90.194,000.00 427,000.00 81.273,000.00 -2,233,000.00 63.970,000.00 -1,806,000 187,078 49.978.623 1,059,320 -306,539 44.635.574 714,369 -370.537 42.452.990 581,741 1 Dell 2 Revenue 3 Total Revenue 4 Cost of Revenue 5 Gross Profit 6 Operating Expenses 7 Research Development 8 Selling General and Administrative 9 Non Recurring 10 Others 11 Total Operating Expenses 12 Operating Income or Loss 13 Income from Continuing Operations 14 Total Other Income Expenses Net 15 Earnings Before Interest and Taxes 16 Interest Expense 17 Income Before Tax 18 Income Tax Expense 19 Minority Interest 20 Net Income From Continuing Ops 21 Non-recurring Events 22 Discontinued Operations 23 Extraordinary Items 24 Effect Of Accounting Changes 25 Other Items 26 Net Income 27 Net Income 28 Preferred Stock And Other Adjustments 29 Net Income Applicable To Common Shares 30 -2.788.000 427,000.00 -2.488.000 -2.361,000.00 -180,000 4.823.000 -2,181,000.00 -2.536.000 -2.233.000.00 -2.406,000 4.769.000.00 -1.843.000 5.766,000 -2,926,000.00 -2.688.000.00 -1.806.000 -1.751,000 4.494.000.00 -1.420.000 5.766,000 -3,074,000.00 Lenovo Revenue Total Revenue Cost of Revenue Gross Profit Operating Expenses Research Development Selling General and Administrative Non Recurring Others Total Operating Expenses Operating Income or Loss Income from Continuing Operations Total Other Income Expenses Net Earnings Before Interest and Taxes Interest Expense Income Before Tax Income Tax Expense Minority Interest Net Income From Continuing Ops Non-recurring Events Discontinued Operations Extraordinary Items Effect Of Accounting Changes Other Items Net Income Net Income Preferred Stock And Other Adjustments Net Income Applicable To Common Shares -202.656 1,059.320 -237.398 856,664 199.460 1.466,848 657,204 561.167 714.369 -187,304 153.202 279.977 1.240.268 -126,775 -91.814 581,741 -198.215 489.927 -40.514 1.084.521 530.441 1.916.000 -2.310,000.00 -2.849,000.00 -1,167,000.00 650,103 -135.643 536.956 -2,310,000.00 -2,849,000.00 -1,167,000.00 596,343 -189,323 535,084 32 Sheet Income Balance Cash Flow + D 2. 3/31/2017 2/1/2019 -2,310,000.00 2/2/2018 -2,849,000.00 2/3/2017 -1,167,000.00 3/31/2018 -135,643 3/31/2016 -128,146 7,535,000 326,000.00 -1,104.000 4.370,000 -1.445.000 -738,000 6,991,000.00 8.552.000 -1.276,000 -1.590,000 6,527,000 -325,000 -2.461,000 6,843,000 4,938,000 -3,517,000.00 -1.935,000 2.684.000 1,076,000 20,000 2,367,000 643.373 -268.763 -1,012,749 919.996 -997.656 599,836 -776,735 -580,005 2.354,218 -156,718 635.906 -50,039 1.172.555 -1,759,818 317,108 -756,293 2,119,822 292,261 1 Dell Period Ending 3 Net Income Operating Activities, Cash Flows Depreciation 6 Adjustments To Net Income Changes In Accounts Receivables 8 Changes In Liabilities 9 Changes In Inventories 10 Changes In Other Operating Activities 11 Total Cash Flow From Operating 12 Investing Activities, Cash Flows Provided 13 Capital Expenditure 14 Investments 15 Other Cash flows from Investing 16 Total Cash Flows From Investing 17 Financing Activities, Cash Flows 18 Dividends Paid 19 Sale Purchase of Stock 20 Net Borrowings 21 Other Cash Flows from Financing 22 Total Cash Flows From Financing 23 Effect Of Exchange Rate Changes 24 Change In Cash and Cash Equivalents H Lenovo Period Ending 3/31/2019 Net Income 650,103 Operating Activities, Cash Flows Provided By or Used In Depreciation 654,885 Adjustments To Net Income 17,774 Changes In Accounts Receivables -326.932 Changes In Liabilities -163.698 Changes In Inventories 496,706 Changes In Other Operating Activities Total Cash Flow From Operating Activities 1,472,573 Investing Activities, Cash Flows Provided By or Used In Capital Expenditure -537.727 Investments -35.832 Other Cash flows from Investing Activities 27,629 Total Cash Flows From Investing Activities Financing Activities, Cash Flows Provided By or Used In Dividends Paid -404.350 Sale Purchase of Stock Net Borrowings 675.215 Other Cash Flows from Financing Activities -148.199 Total Cash Flows From Financing Activities 122,666 Effect Of Exchange Rate Changes -80,657 Change In Cash and Cash Equivalents 814,837 -1.229,000.00 5,687,000 -1.367,000 -511,000 -6,000 -2,875,000 -699,000 395,000 -48.000 -31,236,000 -503.296 170,472 21,523 -1,113,467 463.558 -89,124 -109.101 -1,397,572 -603.816 -51.352 -142,753 -853,645 3,389,000 -380.750 -376,898 -379.367 1,594,000 -1.489,000 -14.329,000.00 -189,000 4,138,000 2.157,000 -640,000 403,000.00 175,000 4,546,000 29,897,000 -1,730,000 31,785,000 727,064 31.988 874,343 88,835 -906,582 -186,352 708.347 145,097 -39.628 827,719 225.554 -151.317 -305,130 -61.829 -928,343 24,000 2,940,000 B DE F H 2/1/2019 2/2/2018 2/3/2017 3/31/2019 3/31/2018 3/31/2017 9,676,000 12.871,000 3.649,000 4,749,000 36,138,000 1,008,000 5.259,000.00 40,089,000 22.887,000 13.942,000 2.187.000 12,221,000 2.678,000 4,365,000 40.328,000 4,174,000 5.390,000.00 39.920,000 28.754,000 9,474,000 1.975,000 9.920,000 2.538.000 2,794,000 30,773,000 3.805,000 5.653.000.00 38.910,000 35,053,000 2.662.854 16.252 9,481,020 3.434,660 139,562 16,886.203 599.910 1.662.914 4.942.289 3.382.286 1,848,017 26,831 8.557,554 3.791.691 98,183 15.663.318 408,743 1.687,596 5,088.221 3,426.283 2,754,599 138.310 8,062.802 2.794,035 131.236 14.868.387 288,465 1,649.410 4,855,738 3.493.407 2.215,000 1.903.000 1.361,000 1 Dell 2 Period Ending 3 Current Assets 4 Cash And Cash Equivalents 5 Short Term Investments 6 Net Receivables 7 Inventory 8 Other Current Assets 9 Total Current Assets 10 Long Term Investments 11 Property, plant and equipment 12 Goodwill 13 Intangible Assets 14 Accumulated Amortization 15 Other Assets 16 Deferred Long Term Asset Charges 17 Total Assets 18 Current Liabilities 19 Accounts Payable 20 Short Current Long Term Debt 21 Other Current Liabilities 22 Total Current Liabilities 23 Long Term Debt 24 Other Liabilities 25 Deferred Long Term Liability Charges 26 Minority Interest 27 Negative Goodwill 28 Total Liabilities 29 Stockholders' Equity 30 Misr Stocks Ontions Warrants Sheet Income Lenovo Period Ending Current Assets Cash And Cash Equivalents Short Term Investments Net Receivables Inventory Other Current Assets Total Current Assets Long Term Investments Property, plant and equipment Goodwill Intangible Assets Accumulated Amortization Other Assets Deferred Long Term Asset Charges Total Assets Current Liabilities Accounts Payable Short/Current Long Term Debt Other Current Liabilities Total Current Liabilities Long Term Debt Other Liabilities Deferred Long Term Liability Charges Minority Interest Negative Goodwill Total Liabilities Stockholders' Equity Misr Stocks Ontions Warrants 2.514.883 1.862.902 29,988,485 2.220.010 1,530,623 28,494,171 2,030,567 1.435,256 27,185,974 111,820,000.00 124,193,000.00 118,206,000.00 7.252.766 6,485,538 19.213,000 1.207.000 17,793,000 44.972.000.00 46.385,000.00 18,589,000 18.334,000 4,546,000 16,684,000 45.839,000.00 42,529,000.00 16,871.000 14.422.000 4.241,000 14,743,000 38,135,000.00 41,685,000.00 18,001,000 7.702,675 786,136 8.864.711 20,490.343 2.426,770 2.974309 9,174,757 19,459,722 2.648,725 1,839,736 9,711.618 18.333.846 2.966,692 1,790.214 4,823,000 5,766,000 5,766,000 1,466,848 1.240.268 1,084,521 112,762,000.00 106,708,000.00 99,197,000.00 25,891,422 23.948,183 23,090,752 Balance Cash Flow + 5.259,000.00 40,089,000 22.887,000 5.390,000.00 39.920,000 28,754.000 5,653,000.00 38.910,000 35,053,000 1.662.914 4.942.289 3.382.286 1.687,596 5,088.221 3,426,283 1.649.410 4.855.738 3,493,407 2.215,000 1.903.000 1.361,000 2.514.883 1.862.902 29,988,485 2.220,010 1,530,623 28,494,171 2,030,567 1.435.256 27,185,974 111,820,000.00 124,193,000.00 118,206,000.00 7.252.766 6,485,538 19.213,000 1.207.000 17,793,000 44.972,000.00 46,385,000.00 18,589,000 18.334.000 4,546,000 16,684,000 45,839,000.00 42,529,000.00 16,871,000 14.422.000 4.241,000 14,743,000 38,135,000.00 41.685,000.00 18.001,000 7,702.675 786,136 8,864,711 20,490.343 2.426,770 2.974,309 9,174,757 19.459,722 2.648,725 1,839,736 9,711,618 18.333.846 2.966,692 1,790.214 11 Property, plant and equipment 12 Goodwill 13 Intangible Assets 14 Accumulated Amortization 15 Other Assets 16 Deferred Long Term Asset Charges 17 Total Assets 18 Current Liabilities 19 Accounts Payable 20 Short/Current Long Term Debt 21 Other Current Liabilities 22 Total Current Liabilities 23 Long Term Debt 24 Other Liabilities 25 Deferred Long Term Liability Charges 26 Minority Interest 27 Negative Goodwill 28 Total Liabilities 29 Stockholders' Equity 30 Misc. Stocks Options Warrants 31 Redeemable Preferred Stock 32 Preferred Stock 33 Common Stock 34 Retained Earnings 35 Treasury Stock 36 Capital Surplus 37 Other Stockholder Equity 38 Total stockholders' equity 39 Net Tangible Assets Property, plant and equipment Goodwill Intangible Assets Accumulated Amortization Other Assets Deferred Long Term Asset Charges Total Assets Current Liabilities Accounts Payable Short Current Long Term Debt Other Current Liabilities Total Current Liabilities Long Term Debt Other Liabilities Deferred Long Term Liability Charges Minority Interest Negative Goodwill Total Liabilities Stockholders' Equity Misc. Stocks Options Warrants Redeemable Preferred Stock Preferred Stock Common Stock Retained Earings Treasury Stock Capital Surplus Other Stockholder Equity Total stockholders' equity Net Tangible Assets 4.823,000 5,766.000 5,766,000 1,466,848 1.240.268 1,084,521 112,762,000.00 106,708,000.00 99,197,000.00 25,891,422 23.948,183 23,090,752 16,114,000 -21.349,000.00 -530,000 19,889,000 -6,860,000.00 -1.310,000 20.199,000 -5,609,000.00 -1.347,000 3.185.923 1.260,745 -1,816,453 3.185.923 1,088,647 -968,850 2.689.882 1.693,614 -1.372.795 -467,000 -5,765,000.00 -68,741,000.00 130,000 11,719,000.00 -56,955,000.00 -595,000 13.243,000.00 -60,720,000.00 -1,816,453 2.630.215 -5,694,360 -968.850 3.305,720 5,208,784 -1.372,795 3,010,701 -5,338.444 40 Sheet Income Balance Cash Flow + 1 Income Balance Cash Flow Revenue 4 Total Revenue 5 Cost of Revenue 6 Gross Profit 7 Operating Expenses 8 Research Development 9 Selling General and Administrative 10 Non Recurring 11 Others 12 Total Operating Expenses 13 Operating Income or Loss 14 Income from Continuing Operations 15 Total Other Income Expenses Net 16 Earnings Before Interest and Taxes 17 Interest Expense 18 Income Before Tax 19 Income Tax Expense 20 Minority Interest 21 Net Income From Continuing Ops 22 Non-recurring Events Discontinued Operations 24 Extraordinarv Items Effect Of Accounting Changes 26 Other Items 27 Net Income 28 Net Income 29 Preferred Stock And Other Adiustments 30 Net Income Applicable To Common Shares Current Assets Cash And Cash Equivalents Short Term Investments Net Receivables Inventorv Other Current Assets Total Current Assets Long Term Investments Property. plant and equipment Goodwill Intangible Assets Accumulated Amortization Other Assets Deferred Long Term Asset Charees Total Assets Current Liabilities Accounts Pavable Short Current Long Term Debt Other Current Liabilities Total Current Liabilities Long Term Debt Other Liabilities Deferred Long Term Liability Charges Minoritv Interest Negative Goodwill Total Liabilities Stockholders' Equity Misc. Stocks Options Warrants Redeemable Preferred Stock Preferred Stock Common Stock Retained Earnings Treasury Stock Capital Surplus Other Stockholder Eauitv Total stockholders' equitv Net Tangible Assets Net Income Operating Activities. Cash Flows Depreciation Adiustments To Net Income Changes In Accounts Receivables Changes In Liabilities Chanses In Inventories Chanses In Other Operating Activities Total Cash Flow From Operating Activities Investing Activities. Cash Flows Provided Capital Expenditure Investments Other Cash flows from Investing Activities Total Cash Flows From Investing Activities Financing Activities. Cash Flows Dividends Paid Sale Purchase of Stock Net Borrowines Other Cash Flows from Financing Activities Total Cash Flows From Financing Activities Effect Of Exchange Rate Changes Change In Cash and Cash Equivalents