How to complete this ratio analysis and have current answers checked for correctness.
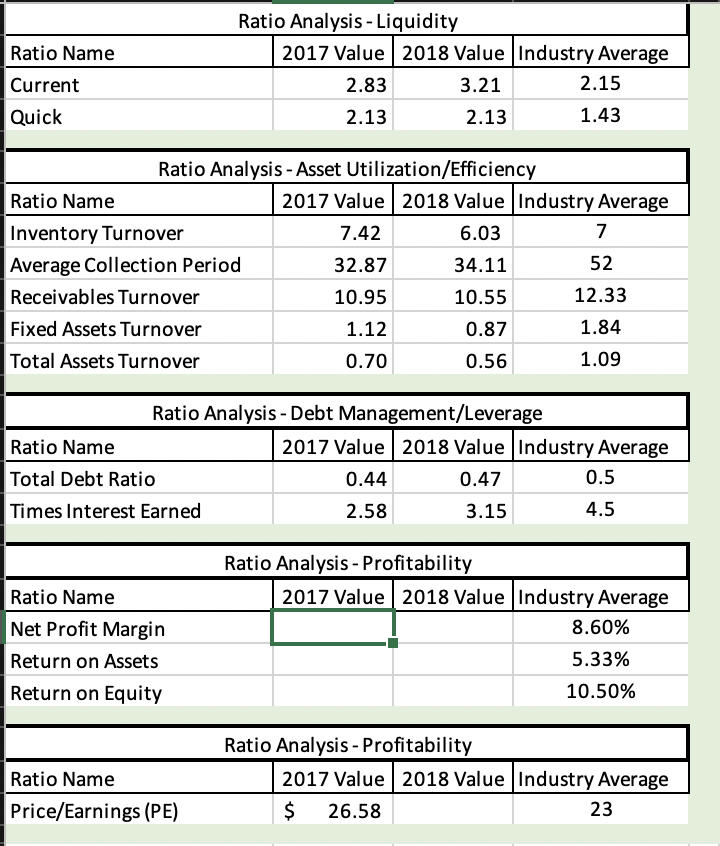
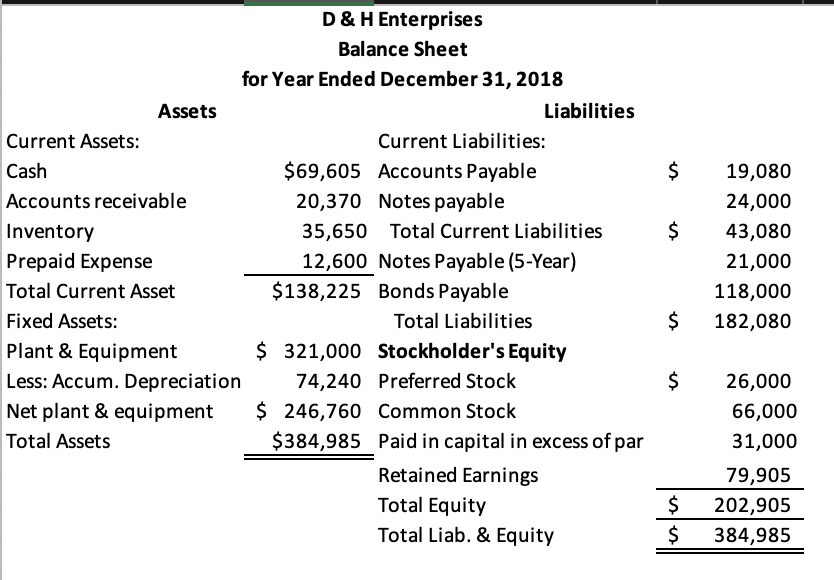
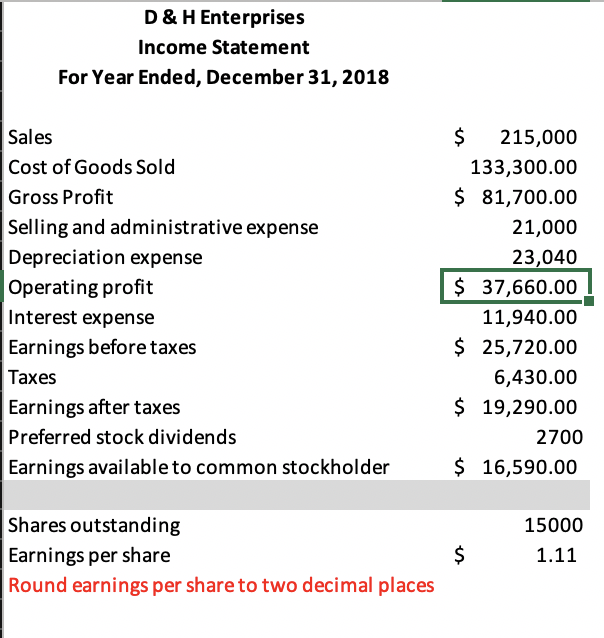
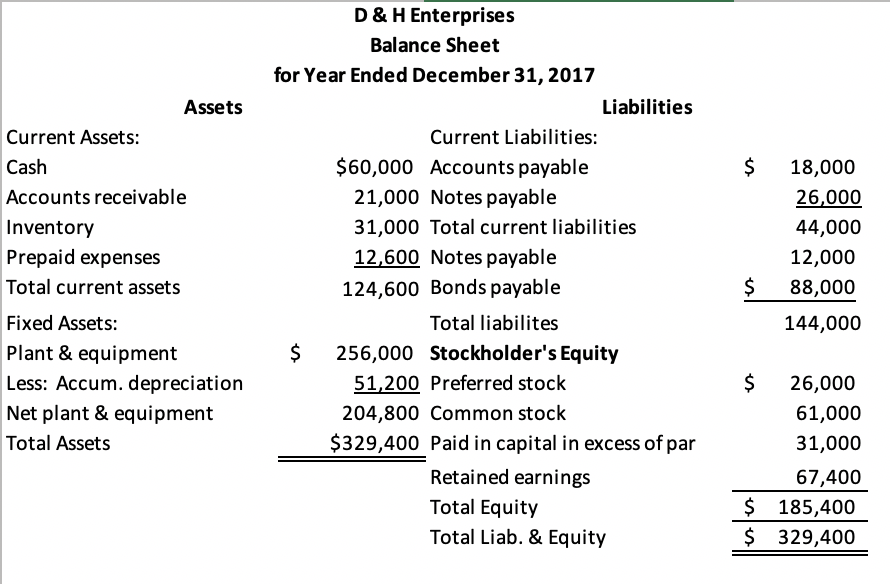
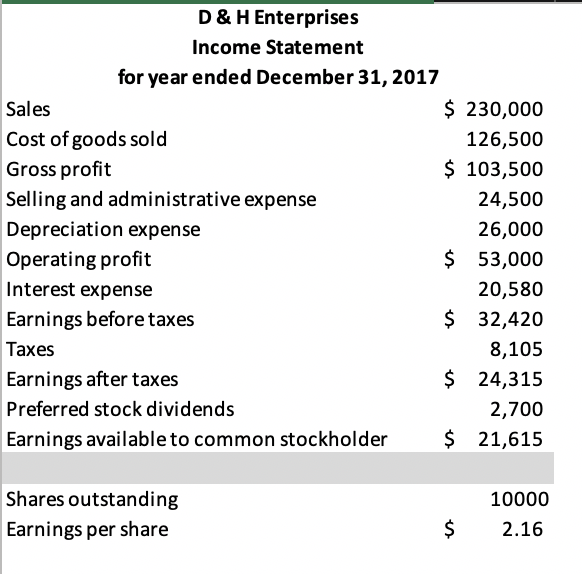
Market price per share of common as of December 31, 2017, was Market price per share of common as of December 31, 2018, was 57.45 51.93 Ratio Name Current Quick Ratio Analysis - Liquidity 2017 Value 2018 Value Industry Average 2.83 3.21 2.15 2.13 2.13 1.43 Ratio Analysis - Asset Utilization/Efficiency Ratio Name 2017 Value 2018 Value Industry Average Inventory Turnover 7.42 6.03 7 Average Collection Period 32.87 34.11 52 Receivables Turnover 10.95 10.55 12.33 Fixed Assets Turnover 1.12 0.87 1.84 Total Assets Turnover 0.70 0.56 1.09 Ratio Analysis - Debt Management/Leverage Ratio Name 2017 Value 2018 Value Industry Average Total Debt Ratio 0.44 0.47 0.5 Times Interest Earned 2.58 3.15 4.5 Ratio Name Net Profit Margin Return on Assets Return on Equity Ratio Analysis - Profitability 2017 Value 2018 Value Industry Average 8.60% 5.33% 10.50% Ratio Name Price/Earnings (PE) Ratio Analysis - Profitability 2017 Value 2018 Value Industry Average $ 26.58 23 $ D & H Enterprises Balance Sheet for Year Ended December 31, 2018 Assets Liabilities Current Assets: Current Liabilities: Cash $69,605 Accounts Payable Accounts receivable 20,370 Notes payable Inventory 35,650 Total Current Liabilities Prepaid Expense 12,600 Notes Payable (5-Year) Total Current Asset $138,225 Bonds Payable Fixed Assets: Total Liabilities Plant & Equipment $ 321,000 Stockholder's Equity Less: Accum. Depreciation 74,240 Preferred Stock Net plant & equipment $ 246,760 Common Stock Total Assets $384,985 Paid in capital in excess of par Retained Earnings Total Equity Total Liab. & Equity 19,080 24,000 43,080 21,000 118,000 182,080 $ 26,000 66,000 31,000 79,905 202,905 384,985 $ $ D & H Enterprises Income Statement For Year Ended, December 31, 2018 Sales Cost of Goods Sold Gross Profit Selling and administrative expense Depreciation expense Operating profit Interest expense Earnings before taxes Taxes Earnings after taxes Preferred stock dividends Earnings available to common stockholder $ 215,000 133,300.00 $ 81,700.00 21,000 23,040 $ 37,660.00 11,940.00 $ 25,720.00 6,430.00 $ 19,290.00 2700 $ 16,590.00 Shares outstanding Earnings per share Round earnings per share to two decimal places 15000 1.11 $ Assets Current Assets: Cash Accounts receivable Inventory Prepaid expenses Total current assets Fixed Assets: Plant & equipment Less: Accum. depreciation Net plant & equipment Total Assets D & H Enterprises Balance Sheet for Year Ended December 31, 2017 Liabilities Current Liabilities: $60,000 Accounts payable 21,000 Notes payable 31,000 Total current liabilities 12,600 Notes payable 124,600 Bonds payable Total liabilites $ 256,000 Stockholder's Equity 51,200 Preferred stock 204,800 Common stock $329,400 Paid in capital in excess of par Retained earnings Total Equity Total Liab. & Equity 18,000 26,000 44,000 12,000 88,000 144,000 $ 26,000 61,000 31,000 67,400 185,400 329,400 $ $ D & H Enterprises Income Statement for year ended December 31, 2017 Sales $ 230,000 Cost of goods sold 126,500 Gross profit $ 103,500 Selling and administrative expense 24,500 Depreciation expense 26,000 Operating profit $ 53,000 Interest expense 20,580 Earnings before taxes $ 32,420 8,105 Earnings after taxes $ 24,315 Preferred stock dividends 2,700 Earnings available to common stockholder $ 21,615 Taxes Shares outstanding Earnings per share 10000 2.16 $ Market price per share of common as of December 31, 2017, was Market price per share of common as of December 31, 2018, was 57.45 51.93 Ratio Name Current Quick Ratio Analysis - Liquidity 2017 Value 2018 Value Industry Average 2.83 3.21 2.15 2.13 2.13 1.43 Ratio Analysis - Asset Utilization/Efficiency Ratio Name 2017 Value 2018 Value Industry Average Inventory Turnover 7.42 6.03 7 Average Collection Period 32.87 34.11 52 Receivables Turnover 10.95 10.55 12.33 Fixed Assets Turnover 1.12 0.87 1.84 Total Assets Turnover 0.70 0.56 1.09 Ratio Analysis - Debt Management/Leverage Ratio Name 2017 Value 2018 Value Industry Average Total Debt Ratio 0.44 0.47 0.5 Times Interest Earned 2.58 3.15 4.5 Ratio Name Net Profit Margin Return on Assets Return on Equity Ratio Analysis - Profitability 2017 Value 2018 Value Industry Average 8.60% 5.33% 10.50% Ratio Name Price/Earnings (PE) Ratio Analysis - Profitability 2017 Value 2018 Value Industry Average $ 26.58 23 $ D & H Enterprises Balance Sheet for Year Ended December 31, 2018 Assets Liabilities Current Assets: Current Liabilities: Cash $69,605 Accounts Payable Accounts receivable 20,370 Notes payable Inventory 35,650 Total Current Liabilities Prepaid Expense 12,600 Notes Payable (5-Year) Total Current Asset $138,225 Bonds Payable Fixed Assets: Total Liabilities Plant & Equipment $ 321,000 Stockholder's Equity Less: Accum. Depreciation 74,240 Preferred Stock Net plant & equipment $ 246,760 Common Stock Total Assets $384,985 Paid in capital in excess of par Retained Earnings Total Equity Total Liab. & Equity 19,080 24,000 43,080 21,000 118,000 182,080 $ 26,000 66,000 31,000 79,905 202,905 384,985 $ $ D & H Enterprises Income Statement For Year Ended, December 31, 2018 Sales Cost of Goods Sold Gross Profit Selling and administrative expense Depreciation expense Operating profit Interest expense Earnings before taxes Taxes Earnings after taxes Preferred stock dividends Earnings available to common stockholder $ 215,000 133,300.00 $ 81,700.00 21,000 23,040 $ 37,660.00 11,940.00 $ 25,720.00 6,430.00 $ 19,290.00 2700 $ 16,590.00 Shares outstanding Earnings per share Round earnings per share to two decimal places 15000 1.11 $ Assets Current Assets: Cash Accounts receivable Inventory Prepaid expenses Total current assets Fixed Assets: Plant & equipment Less: Accum. depreciation Net plant & equipment Total Assets D & H Enterprises Balance Sheet for Year Ended December 31, 2017 Liabilities Current Liabilities: $60,000 Accounts payable 21,000 Notes payable 31,000 Total current liabilities 12,600 Notes payable 124,600 Bonds payable Total liabilites $ 256,000 Stockholder's Equity 51,200 Preferred stock 204,800 Common stock $329,400 Paid in capital in excess of par Retained earnings Total Equity Total Liab. & Equity 18,000 26,000 44,000 12,000 88,000 144,000 $ 26,000 61,000 31,000 67,400 185,400 329,400 $ $ D & H Enterprises Income Statement for year ended December 31, 2017 Sales $ 230,000 Cost of goods sold 126,500 Gross profit $ 103,500 Selling and administrative expense 24,500 Depreciation expense 26,000 Operating profit $ 53,000 Interest expense 20,580 Earnings before taxes $ 32,420 8,105 Earnings after taxes $ 24,315 Preferred stock dividends 2,700 Earnings available to common stockholder $ 21,615 Taxes Shares outstanding Earnings per share 10000 2.16 $