how to do balance sheet, income statement, cash flow statement and calculate cost of capital with these datas?
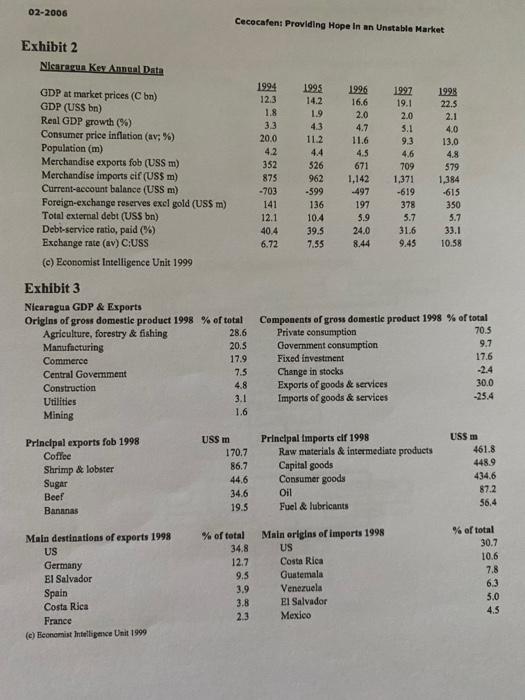
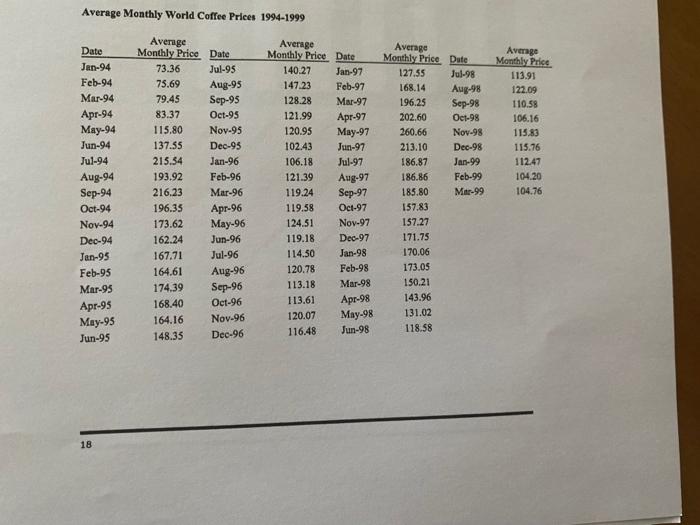
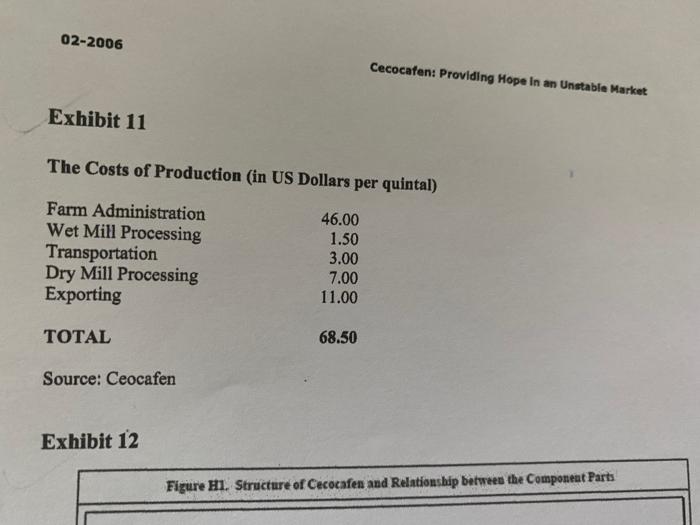
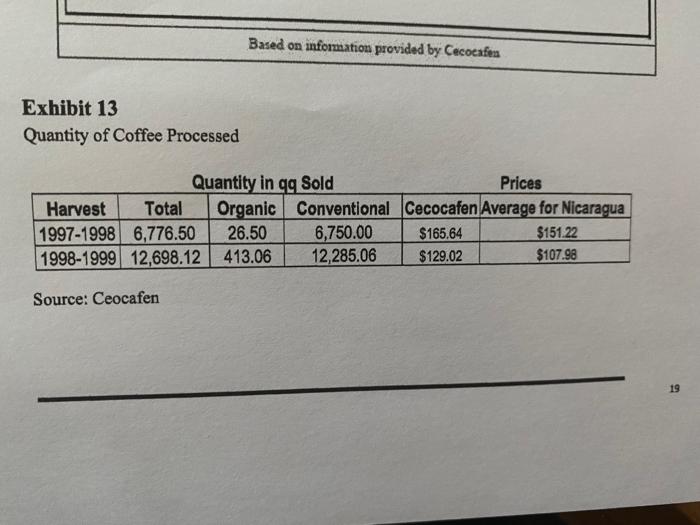
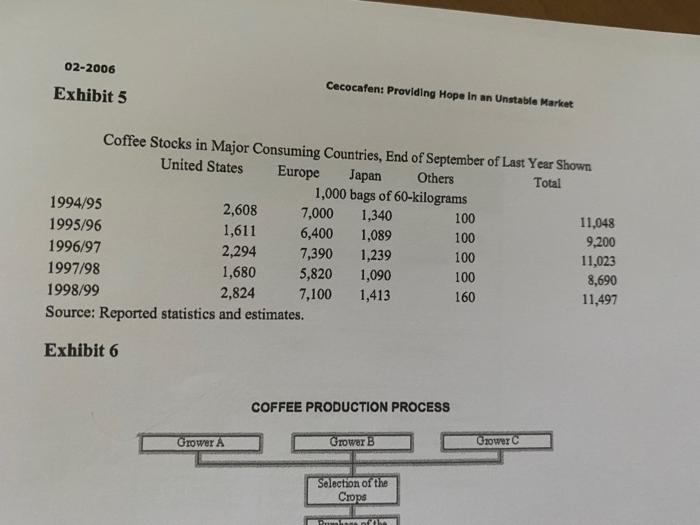
02-2006 Cecocafen: Providing Hope In an Unstable Market Exhibit 2 Nicaretua Key Anneal Data 1994 12.3 1.8 33 20.0 4.2 1995 14.2 1.9 4.3 112 4.4 526 962 -599 136 10.4 39.5 7.55 352 1996 16.6 2.0 4.7 11.6 4.5 671 1,142 -497 197 5.9 24.0 8.44 1997 19.1 2.0 3.1 93 4.6 709 1,371 1998 22.5 2.1 4.0 13.0 4.8 579 1,384 -615 350 5.7 33.1 10.58 -619 875 -703 141 12.1 40.4 6.72 378 5.7 31.6 9.45 GDP at market prices (bn) GDP (USS bn) Real GDP growth (%) Consumer price inflution (av: %) Population (m) Merchandise exports fob (USS m) Merchandise imports cif (US$ m) Current-account balance (USS m) Foreign-exchange reserves excl gold (USS m) Total external debt (USS bn) Debt-service ratio, paid (%) Exchange rate (av) C:USS (c) Economist Intelligence Unit 1999 Exhibit 3 Nicaragua GDP & Exports Origins of gross domestic product 1998 % of total Agriculture, forestry & fishing 28.6 Manufacturing 20.5 Commerce 17.9 Central Government 7.5 Construction 4.8 Utilities 3.1 1.6 Mining Components of gross domestic product 1998 % of total Private consumption 70.5 Government consumption 9.7 Fixed Investment 17.6 Change in stocks -2.4 Exports of goods & services 30.0 Imports of goods & services -25.4 USS m Principal exports fob 1998 Coffee Shrimp & lobster Sugar Beef Bananas USS m 170.7 86.7 44.6 34.6 19.5 Principal Imports elf 1998 Raw materials & intermediate produets Capital goods Consumer goods Oil Fuel & lubricants 461.8 448.9 434.6 87.2 56.4 Main destinations of exports 1998 US Germany El Salvador Spain Costa Rica France (c) Bonomist Intelligence Unit 1999 % of total 34.8 12.7 9.5 3.9 3.8 2.3 Main eriglas of imports 1998 US Costa Rica Guatemala Venezuela El Salvador Mexico % of total 30.7 10.6 7.8 6.3 5.0 45 02-2006 Exhibit 5 Cecocafen: Providing Hope in an unstable Market Coffee Stocks in Major Consuming Countries, End of September of Last Year Shown United States Europe Japan Others Total 1,000 bags of 60-kilograms 1994/95 2,608 7,000 1,340 100 11,048 1995/96 1,611 6,400 1,089 100 9,200 1996/97 2,294 7,390 1,239 100 11,023 1997/98 1,680 5,820 1,090 100 8,690 1998/99 2,824 7,100 1,413 160 11,497 Source: Reported statistics and estimates. Exhibit 6 COFFEE PRODUCTION PROCESS Grower A Grower B Gower Selection of the Crops Average Monthly World Coffee Prices 1994-1999 Date Jan-94 Feb-94 Mar-94 Apr-94 May-94 Jun-94 Jul-94 Aug-94 Sep-94 Oct-94 Nov-94 Dec-94 Jan-95 Feb-95 Mar-95 Apr-95 May-95 Jun-95 Average Monthly Price Date 73.36 Jul-95 75.69 Aug-95 79.45 Sep-95 83.37 Oct-95 115.80 Nov.95 137.55 Dec-95 215.54 Jan-96 193.92 Feb-96 216.23 Mar-96 196.35 Apr-96 173.62 May-96 162.24 Jun-96 167.71 Jul-96 164.61 Aug-96 174.39 Sep-96 168.40 Oct-96 164.16 Nov-96 148.35 Dec-96 Average Monthly Price Date 140.27 Jan-97 147.23 Feb-97 128.28 Mar-97 121.99 Apr-97 120.95 May-97 102.43 Jun-97 106.18 Jul-97 121.39 Aug-97 119.24 Sep-97 119.58 Oct-97 124.51 Nov-97 119.18 Dec-97 114.50 Jan-98 120.78 Feb-98 113.18 Mar.98 113.61 Apr-98 120.07 May-98 116.48 Jun-98 Average Monthly Price Date 127.55 Jul-98 168.14 Aug-98 196.25 Sep-98 202.60 Oct-98 260.66 Nov-98 213.10 Dec-98 186.87 Jan-99 186.86 Feb-99 185.80 Mar-99 157.83 157.27 171.75 170.06 173.05 150.21 143.96 131.02 118.58 Average Monthly Price 113.91 122.09 110.58 106.16 115.83 115.76 112.47 104.20 104.76 18 02-2006 Cecocafen: Providing Hope In an unstable Market Exhibit 11 The Costs of Production in US Dollars per quintal) Farm Administration Wet Mill Processing Transportation Dry Mill Processing Exporting 46.00 1.50 3.00 7.00 11.00 TOTAL 68.50 Source: Ceocafen Exhibit 12 Figure HI. Structure of Cecocafen and Relationship between the Component Parts Based on information provided by Cecocafen Exhibit 13 Quantity of Coffee Processed Quantity in qg Sold Prices Harvest Total Organic Conventional Cecocafen Average for Nicaragua 1997-1998 6,776.50 26.50 6,750.00 $165.64 $151.22 1998-1999 12,698.12 413.06 12,285.06 $129.02 $107.98 Source: Ceocafen 19 02-2006 Cecocafen: Providing Hope In an Unstable Market Exhibit 2 Nicaretua Key Anneal Data 1994 12.3 1.8 33 20.0 4.2 1995 14.2 1.9 4.3 112 4.4 526 962 -599 136 10.4 39.5 7.55 352 1996 16.6 2.0 4.7 11.6 4.5 671 1,142 -497 197 5.9 24.0 8.44 1997 19.1 2.0 3.1 93 4.6 709 1,371 1998 22.5 2.1 4.0 13.0 4.8 579 1,384 -615 350 5.7 33.1 10.58 -619 875 -703 141 12.1 40.4 6.72 378 5.7 31.6 9.45 GDP at market prices (bn) GDP (USS bn) Real GDP growth (%) Consumer price inflution (av: %) Population (m) Merchandise exports fob (USS m) Merchandise imports cif (US$ m) Current-account balance (USS m) Foreign-exchange reserves excl gold (USS m) Total external debt (USS bn) Debt-service ratio, paid (%) Exchange rate (av) C:USS (c) Economist Intelligence Unit 1999 Exhibit 3 Nicaragua GDP & Exports Origins of gross domestic product 1998 % of total Agriculture, forestry & fishing 28.6 Manufacturing 20.5 Commerce 17.9 Central Government 7.5 Construction 4.8 Utilities 3.1 1.6 Mining Components of gross domestic product 1998 % of total Private consumption 70.5 Government consumption 9.7 Fixed Investment 17.6 Change in stocks -2.4 Exports of goods & services 30.0 Imports of goods & services -25.4 USS m Principal exports fob 1998 Coffee Shrimp & lobster Sugar Beef Bananas USS m 170.7 86.7 44.6 34.6 19.5 Principal Imports elf 1998 Raw materials & intermediate produets Capital goods Consumer goods Oil Fuel & lubricants 461.8 448.9 434.6 87.2 56.4 Main destinations of exports 1998 US Germany El Salvador Spain Costa Rica France (c) Bonomist Intelligence Unit 1999 % of total 34.8 12.7 9.5 3.9 3.8 2.3 Main eriglas of imports 1998 US Costa Rica Guatemala Venezuela El Salvador Mexico % of total 30.7 10.6 7.8 6.3 5.0 45 02-2006 Exhibit 5 Cecocafen: Providing Hope in an unstable Market Coffee Stocks in Major Consuming Countries, End of September of Last Year Shown United States Europe Japan Others Total 1,000 bags of 60-kilograms 1994/95 2,608 7,000 1,340 100 11,048 1995/96 1,611 6,400 1,089 100 9,200 1996/97 2,294 7,390 1,239 100 11,023 1997/98 1,680 5,820 1,090 100 8,690 1998/99 2,824 7,100 1,413 160 11,497 Source: Reported statistics and estimates. Exhibit 6 COFFEE PRODUCTION PROCESS Grower A Grower B Gower Selection of the Crops Average Monthly World Coffee Prices 1994-1999 Date Jan-94 Feb-94 Mar-94 Apr-94 May-94 Jun-94 Jul-94 Aug-94 Sep-94 Oct-94 Nov-94 Dec-94 Jan-95 Feb-95 Mar-95 Apr-95 May-95 Jun-95 Average Monthly Price Date 73.36 Jul-95 75.69 Aug-95 79.45 Sep-95 83.37 Oct-95 115.80 Nov.95 137.55 Dec-95 215.54 Jan-96 193.92 Feb-96 216.23 Mar-96 196.35 Apr-96 173.62 May-96 162.24 Jun-96 167.71 Jul-96 164.61 Aug-96 174.39 Sep-96 168.40 Oct-96 164.16 Nov-96 148.35 Dec-96 Average Monthly Price Date 140.27 Jan-97 147.23 Feb-97 128.28 Mar-97 121.99 Apr-97 120.95 May-97 102.43 Jun-97 106.18 Jul-97 121.39 Aug-97 119.24 Sep-97 119.58 Oct-97 124.51 Nov-97 119.18 Dec-97 114.50 Jan-98 120.78 Feb-98 113.18 Mar.98 113.61 Apr-98 120.07 May-98 116.48 Jun-98 Average Monthly Price Date 127.55 Jul-98 168.14 Aug-98 196.25 Sep-98 202.60 Oct-98 260.66 Nov-98 213.10 Dec-98 186.87 Jan-99 186.86 Feb-99 185.80 Mar-99 157.83 157.27 171.75 170.06 173.05 150.21 143.96 131.02 118.58 Average Monthly Price 113.91 122.09 110.58 106.16 115.83 115.76 112.47 104.20 104.76 18 02-2006 Cecocafen: Providing Hope In an unstable Market Exhibit 11 The Costs of Production in US Dollars per quintal) Farm Administration Wet Mill Processing Transportation Dry Mill Processing Exporting 46.00 1.50 3.00 7.00 11.00 TOTAL 68.50 Source: Ceocafen Exhibit 12 Figure HI. Structure of Cecocafen and Relationship between the Component Parts Based on information provided by Cecocafen Exhibit 13 Quantity of Coffee Processed Quantity in qg Sold Prices Harvest Total Organic Conventional Cecocafen Average for Nicaragua 1997-1998 6,776.50 26.50 6,750.00 $165.64 $151.22 1998-1999 12,698.12 413.06 12,285.06 $129.02 $107.98 Source: Ceocafen 19