

Question
How to do the graph on the right? (refer to picture) Instructions on f. Assume Spain has 10 hours it can allocate toward the production
How to do the graph on the right? (refer to picture)
Instructions on f.
Assume Spain has 10 hours it can allocate toward the production of wine and suits. Carefully follow the steps below to draw the required objects on the figure to the right.
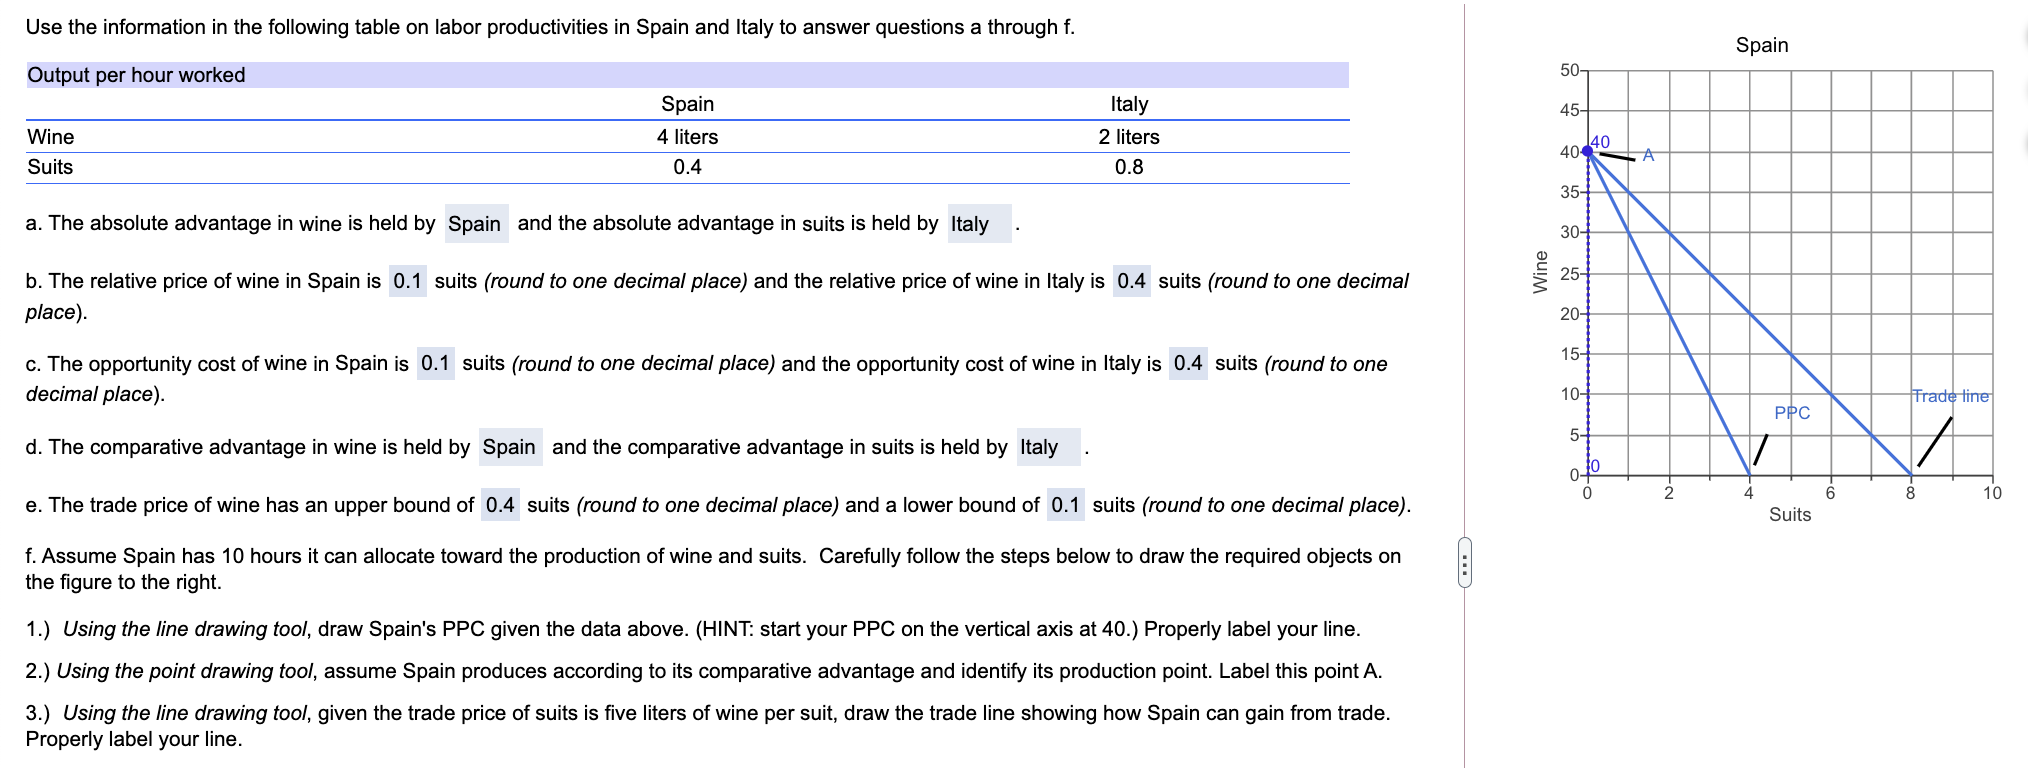
Use the information in the following table on labor productivities in Spain and Italy to answer questions a through f. Spain Output per hour worked 50- 45- Wine Suits Spain 4 liters 0.4 Italy 2 liters 0.8 40 40 35- a. The absolute advantage in wine is held by Spain and the absolute advantage in suits is held by Italy 30+ Wine 25- b. The relative price of wine in Spain is 0.1 suits (round to one decimal place) and the relative price of wine in Italy is 0.4 suits (round to one decimal place). 20- 15- c. The opportunity cost of wine in Spain is 0.1 suits (round to one decimal place) and the opportunity cost of wine in Italy is 0.4 suits (round to one decimal place) 10- Trade tine PPC 5- d. The comparative advantage in wine is held by Spain and the comparative advantage in suits is held by Italy ofo V 0 4 6 8 10 e. The trade price of wine has an upper bound of 0.4 suits (round to one decimal place) and a lower bound of 0.1 suits (round to one decimal place). Suits f. Assume Spain has 10 hours it can allocate toward the production of wine and suits. Carefully follow the steps below to draw the required objects on the figure to the right. 1.) Using the line drawing tool, draw Spain's PPC given the data above. (HINT: start your PPC on the vertical axis at 40.) Properly label your line. 2.) Using the point drawing tool, assume Spain produces according to its comparative advantage and identify its production point. Label this point A. 3.) Using the line drawing tool, given the trade price of suits is five liters of wine per suit, draw the trade line showing how Spain can gain from trade. Properly label your line. Use the information in the following table on labor productivities in Spain and Italy to answer questions a through f. Spain Output per hour worked 50- 45- Wine Suits Spain 4 liters 0.4 Italy 2 liters 0.8 40 40 35- a. The absolute advantage in wine is held by Spain and the absolute advantage in suits is held by Italy 30+ Wine 25- b. The relative price of wine in Spain is 0.1 suits (round to one decimal place) and the relative price of wine in Italy is 0.4 suits (round to one decimal place). 20- 15- c. The opportunity cost of wine in Spain is 0.1 suits (round to one decimal place) and the opportunity cost of wine in Italy is 0.4 suits (round to one decimal place) 10- Trade tine PPC 5- d. The comparative advantage in wine is held by Spain and the comparative advantage in suits is held by Italy ofo V 0 4 6 8 10 e. The trade price of wine has an upper bound of 0.4 suits (round to one decimal place) and a lower bound of 0.1 suits (round to one decimal place). Suits f. Assume Spain has 10 hours it can allocate toward the production of wine and suits. Carefully follow the steps below to draw the required objects on the figure to the right. 1.) Using the line drawing tool, draw Spain's PPC given the data above. (HINT: start your PPC on the vertical axis at 40.) Properly label your line. 2.) Using the point drawing tool, assume Spain produces according to its comparative advantage and identify its production point. Label this point A. 3.) Using the line drawing tool, given the trade price of suits is five liters of wine per suit, draw the trade line showing how Spain can gain from trade. Properly label your line
Step by Step Solution
There are 3 Steps involved in it
Step: 1

Get Instant Access to Expert-Tailored Solutions
See step-by-step solutions with expert insights and AI powered tools for academic success
Step: 2

Step: 3
Ace Your Homework with AI
Get the answers you need in no time with our AI-driven, step-by-step assistance
Get Started
Elliot Wave Techniques Simplified How To Use The Probability Matrix To Profit On More Trades
Authors: Bennett A. McDowell
1st Edition
0071819304,0071819312