

Answered step by step
Verified Expert Solution
Question
1 Approved Answer
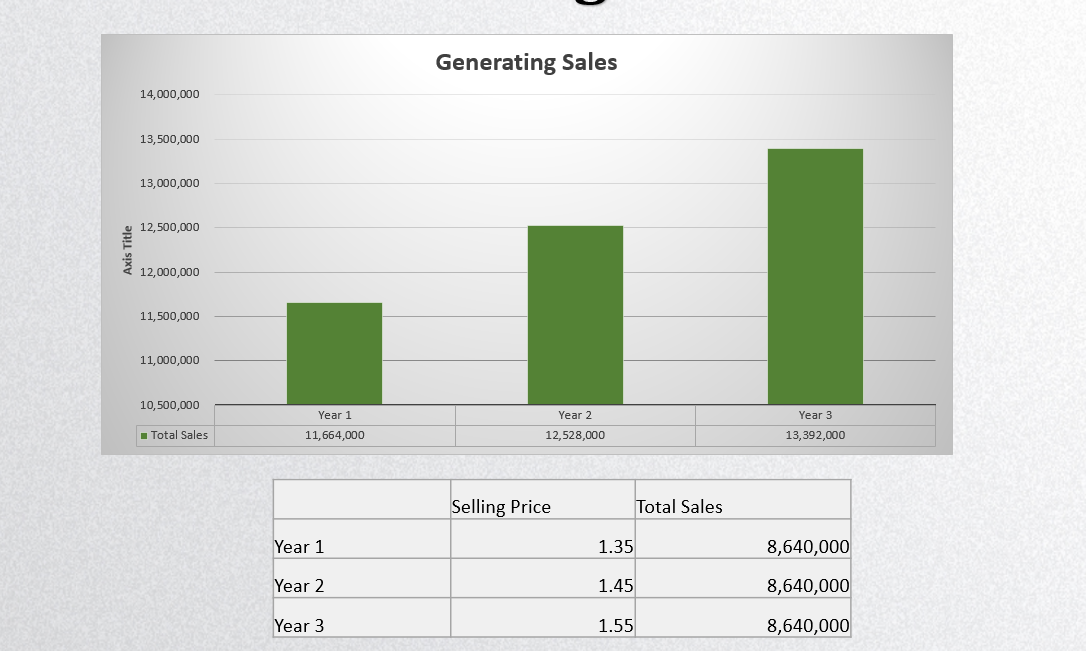
How to Explain this numbers & Chart in the picture for a presentation? Please with Explanation fSell 720,000 per month for 1.35 each Break Even
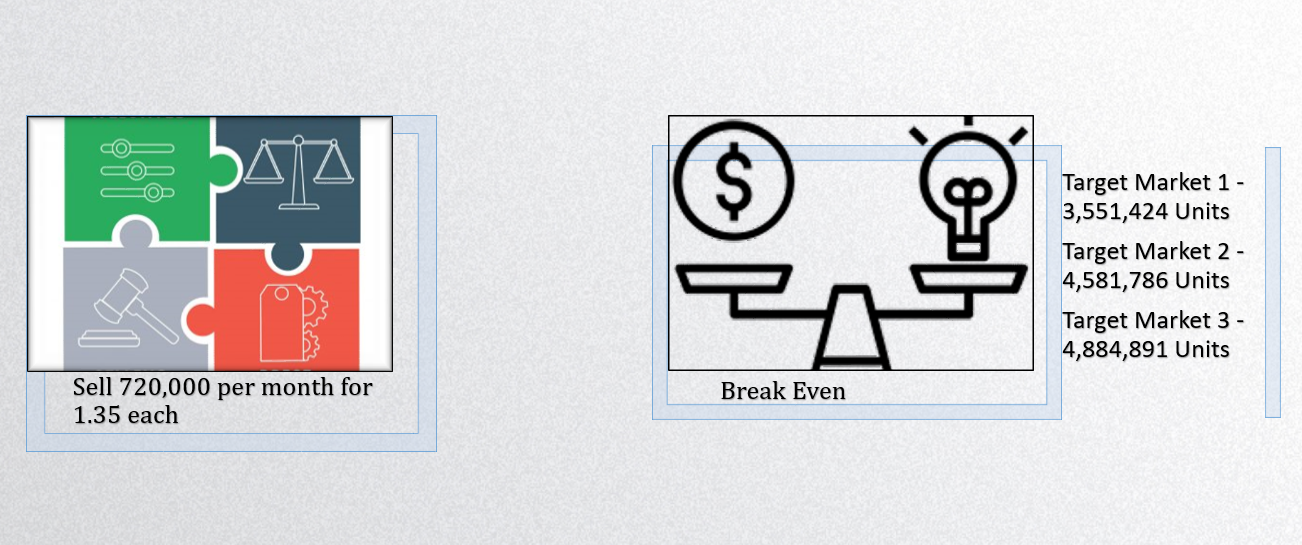
- How to Explain this numbers & Chart in the picture for a presentation? Please with Explanation

Step by Step Solution
There are 3 Steps involved in it
Step: 1

Get Instant Access to Expert-Tailored Solutions
See step-by-step solutions with expert insights and AI powered tools for academic success
Step: 2

Step: 3
Ace Your Homework with AI
Get the answers you need in no time with our AI-driven, step-by-step assistance
Get Started
Financial Accounting
Authors: Robert Libby, Patricia Libby, Frank Hodge
10th edition
1259964949, 1259964947, 978-1259964947