

Answered step by step
Verified Expert Solution
Question
1 Approved Answer
How to find the listed ratio analysis based on the 2017 annual report by using the below formulation ??? 1. turnover of total assets =
How to find the listed ratio analysis based on the "2017 annual report" by using the below formulation ??? 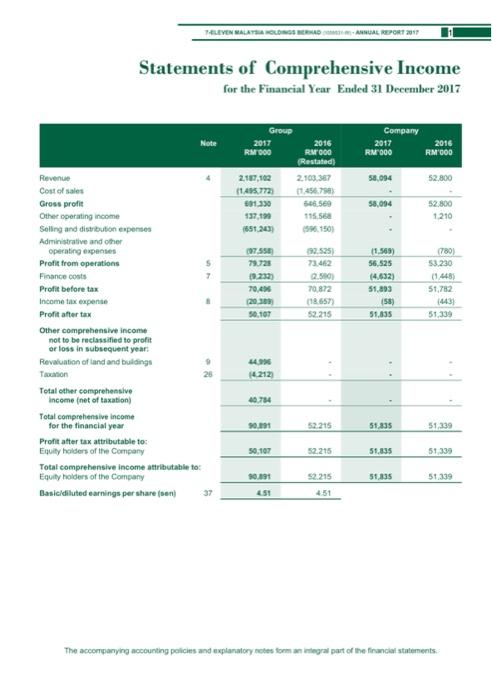
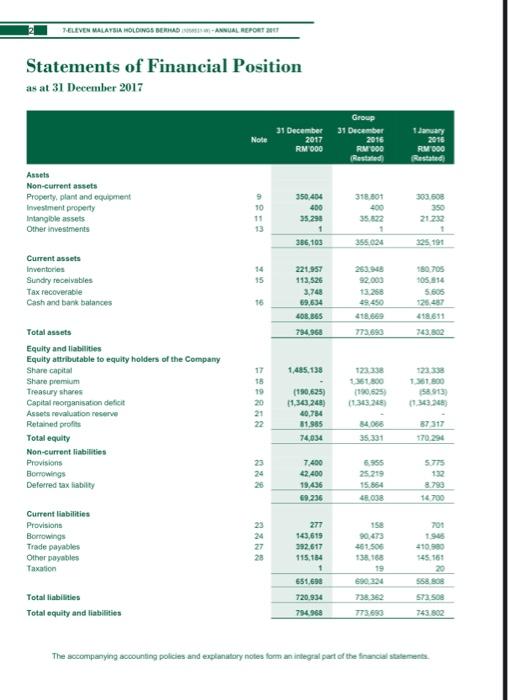
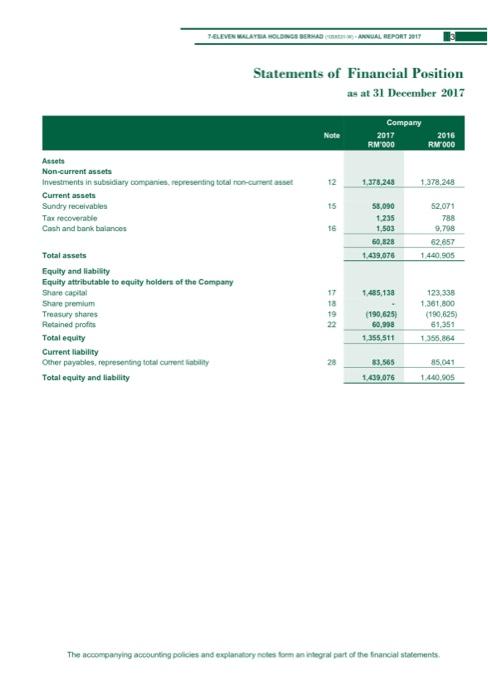
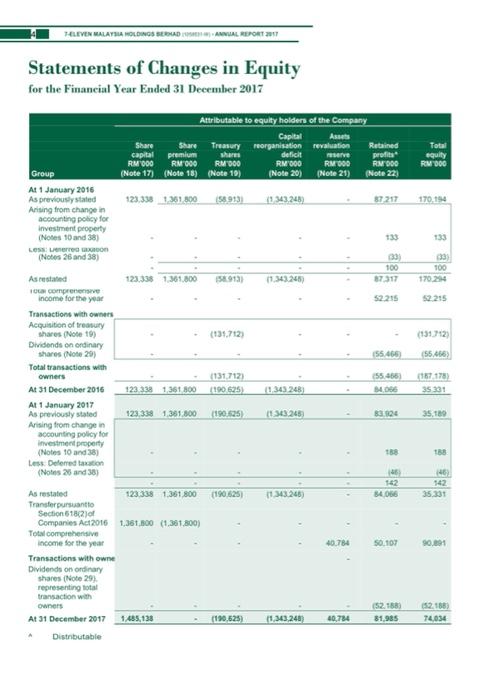
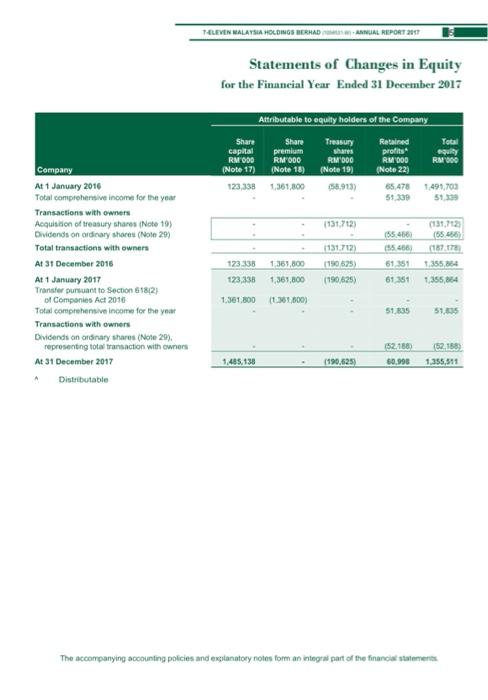
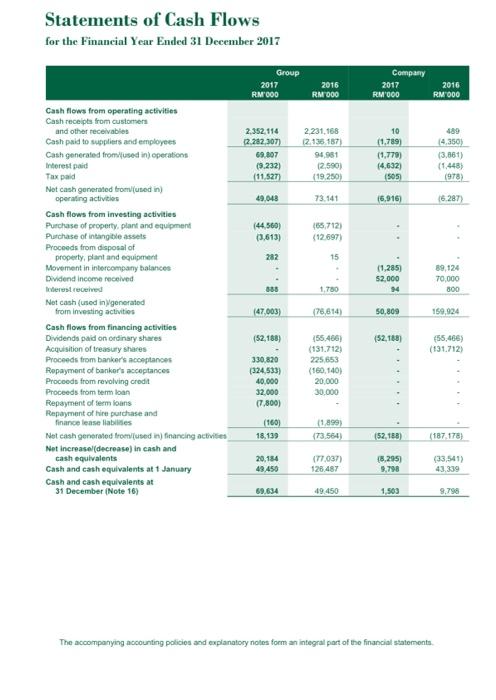
ANNUAL REPORT 2017 Statements of Comprehensive Income for the Financial Year Ended 31 December 2017 Note Company 2017 RM 000 2016 RM000 Group 2017 2016 RM 000 RM200 Restated) 2.167,102 2.103.17 (1495.7723 11.456.790) 301.330 566.569 137,19 115.568 1651.20 58,094 52.800 50,094 52,800 1.210 07.550 780) 53.230 7 32.525) 73.462 2.500 70872 (12.657 52.215 11.565) 56.525 (4.632) 51,893 (58) 51.835 70.490 20.30 50.107 51,782 (443) 51,339 Revenue Cost of sales Gross profit Other operating income Selling and distribution expenses Administrative and other operating expenses Profit from operations Finance costs Profit before tax Income tax expense Profit after tax Other comprehensive income not to be reclassified to profit or loss in subsequent year Revaluation of land and buildings Totion Total other comprehensive income (net of taxation Total comprehensive income for the financial year Profit after tax attributable to: Equity holders of the Company Total comprehensive income attributable to Equity holders of the Company Baslediluted earnings per share on 44 40.784 90.001 52.215 51.835 51,339 50.107 52215 51.835 51330 90.191 51.335 51339 52.215 4.51 451 The accompanying accounting policies and explanatory to integral part of the financial statements TELEVEN MALAYSIA HOLDINGS BERHAD ANNUAL REPORT Statements of Financial Position as at 31 December 2017 Note Group 31 December 31 December 2016 RM 000 RM 000 Restated 2017 2016 RM 000 Restate 303.500 Assets Non-current assets Property, plant and equipment Investment property Intangible assets Other investments 10 350.404 400 35.290 1 386,103 318.801 400 55522 1 355.624 21 232 325191 Current assets Inventories Sundry receivables Tax recoverable Cash and bank balances 15 250.00 92.000 13.268 221,957 113.526 3,748 69,634 408.865 294,960 180.705 105.14 5.605 125.487 418.651 16 773.693 743.302 1,485,138 15 19 123.338 1361300 (190,625 (1.33.248 123.333 1.561.800 58.913) Total assets Equity and liabilities Equity attributable to equity holders of the Company Share capital Share premium Treasury shares Capital reorganisation deficit Assets evaluation reserve Retained profits Total equity Non-current liabilities Provisions Borrowings Deferred tax liability 21 22 (190,625) 11.30.248) 40,784 81.985 74,034 34.068 35,331 87 317 170.294 23 24 5.775 7.400 42.400 19.436 69,236 25 219 15.664 8008 8.790 14 700 Current liabilities Provisions Borrowings Trade payables Other payables Taxation 23 24 27 28 158 90.473 261506 701 1965 277 143,619 392.617 115.154 1 651,690 720.934 145.161 Total liabilities Total equity and liabilities 738352 773650 Se so 573 508 743.802 794968 The accompanying accounting policies and explanatory notes for an integral part of the financial statements TELEVEN WILAYA HOLDINGS BERHAD OVAL REPORT PIT Statements of Financial Position as at 31 December 2017 Note Company 2017 RM 000 2016 RMOOC 12 1.378,243 1378,248 Non-current assets Investments in subsidiary companies, representing total concurrent asset Current assets Sundry receivables Tax recoverable Cash and bank balances 15 16 55,090 1235 1,503 60,828 1.439,078 52.071 788 9,798 62.657 1.440.005 1.485,138 Total assets Equity and liability Equity atributable to equity holders of the Company Share capital Share premium Treasury shares Retained profes Total equity Current liability Other payables, representing total current ability Total equity and liability 19 22 (190,625) 60,998 1,355,511 123.338 1.361.800 (190,625) 61 351 1.355.864 83.565 1.439,076 85.041 1.440.005 The accompanying accounting policies and explanatory notes for an integral part of the financial statements TELEVEN MALAYSIA HOLDINGS SERANNUAL REPORT Statements of Changes in Equity for the Financial Year Ended 31 December 2017 Attributable to equlty holders of the Company Capital Asses Share Share Treasury reorganisation revaluation Retained capital premium deficit merve profita RM 000 RM 600 RM200 RM 600 RM 500 RM 500 (Note 17) (Note 18) (Note 19) (Note 20) (Note 21) (Note 22) Total equity RM 800 123.338 1361 800 58913) 12.343,245) 87217 170.14 133 133 (33) 100 87317 100 123.338 1.361.800 1589131 11.343.245) 52.215 52.215 Group At 1 January 2016 As previously stated Arising from change in accounting policy for Investment property (Notes 10 and 38) Lesenere (Notes 25 and 38) As restated a compreensive Income for the year Transactions with owners Acquisition of treasury shares (Note 19) Dividends on ordinary shares (Note 29) Total transactions with owners At 31 December 2016 Al 1 January 2017 As previously stated Arising from change in accounting policy for investment property (Notes 10 and 3) Less Deferred taxation (Notes 26 and 38) (139,712) (131.712) 55.466 55.456 (131 712) 55.455) S4066 123 338 1 361 800 11345 243) 35 331 123 338 1.361.800 (190.005) 1363.245 33.24 35.100 45 (190.625 11.343.245) 8406 35.331 40.784 50.107 90,001 As restated 123.338 1.361.800 Transfer pursuant to Section 61862) Companies Act 2016 1,361.000 (1,361.800) Total comprehensive Income for the year Transactions with owne Dividends on ordinary shares (Note 29 representing total transaction with owners At 31 December 2017 1,485,138 Distributable 152188 81,985 (1,343240 40,784 74.034 TELEVEN MALAYSIA HOLDINGS BERHADIAL REPORT 2007 Statements of Changes in Equity for the Financial Year Ended 31 December 2017 Attributable to equity holders of the Company Share capital RMODO (Note 17) Share premium RMODO (Note 18) 1,361 300 Treasury shares RM 600 (Note 19) 55,913) Total guilty RM 600 Retained profits RM DOO (Note 22) 65.478 59.339 123 338 1.491,700 51 159 (151.7123 (131,7123 (55.46 (55,456 55.466) 123,338 Company At 1 January 2016 Total comprehensive income for the year Transactions with owners Acquisition of treasury shares (Note 10) Dividends on ordinary shares (Note 29) Total transactions with owners At 31 December 2016 At 1 January 2017 Transfer pursuant to Section 618/2) of Companies Act 2016 Total comprehensive income for the year Transactions with owners Dividends on ordinary shares (Note 29). representing total transaction with owners At 31 December 2017 Distributable 1,365,800 1,361,800 1131.712) 1190.525) (190,625) 61351 61351 1.355,254 1,355,854 123,338 1.361,800 11.361.800) 51.35 51.00 (52.168 1.355,511 1,485.138 1190.625) 60998 The accompanying accounting policies and explanatory notes for an integral part of the financial statements Statements of Cash Flows for the Financial Year Ended 31 December 2017 Group 2017 RM 000 2016 Company 2017 RM 000 RM 000 2016 RM 000 2.352.114 12.282,307) 69.107 (9.232) (11 527 2.231,168 12.135.137) 94981 12.590) (19.250) 10 (1,789) (1,779) (4.632) 489 14.350) (3,861) (1.448) (978) 1505 49,043 73.141 16,916) 16.287 (44560) (3.613) 165,712 (12.697) 282 15 (1,285) 52,000 94 89,124 70,000 800 888 1.750 Cash flows from operating activities Cash receipts from customer and other receivables Cash paid to suppliers and employees Cash generated from used in operations Interest paid Tax paid Not cash generated from(uted in) operating activities Cash flows from investing activities Purchase of property, plant and equipment Purchase of intangible assets Proceeds from disposal of property, plant and equipment Movement in intercompany balances Dividend income received Interest received Net cash (used in generated from investing activities Cash flows from financing activities Dividends paid on ordinary shares Acquisition of treasury shares Proceeds from banker's comptances Repayment of banker's acceptances Proceeds from revolving credit Proceeds from term loan Repayment of ferm loans Repayment of hire purchase and finance lease labies Net cash generated from used in financing activities Not Increase (decrease in cash and cash equivalents Cash and cash equivalents at 1 January Cash and cash equivalents at 31 December Note 16) (47,003) 50,809 159,924 (52.188 52,180) (55,466) (131.712) 330,820 (324.533) 40,000 32.000 (7.800) (55.486) (131.7121 225,653 (160.140) 20.000 30,000 (160) (1.899) 73.564) 18.139 (52,183) 187.178) 20,184 48.450 (77.037) 128.487 (8,295) 9,798 (33,541) 43.339 49.450 1,503 9,798 The accompanying accounting policies and explanatory notes for an integral part of the financial statements ANNUAL REPORT 2017 Statements of Comprehensive Income for the Financial Year Ended 31 December 2017 Note Company 2017 RM 000 2016 RM000 Group 2017 2016 RM 000 RM200 Restated) 2.167,102 2.103.17 (1495.7723 11.456.790) 301.330 566.569 137,19 115.568 1651.20 58,094 52.800 50,094 52,800 1.210 07.550 780) 53.230 7 32.525) 73.462 2.500 70872 (12.657 52.215 11.565) 56.525 (4.632) 51,893 (58) 51.835 70.490 20.30 50.107 51,782 (443) 51,339 Revenue Cost of sales Gross profit Other operating income Selling and distribution expenses Administrative and other operating expenses Profit from operations Finance costs Profit before tax Income tax expense Profit after tax Other comprehensive income not to be reclassified to profit or loss in subsequent year Revaluation of land and buildings Totion Total other comprehensive income (net of taxation Total comprehensive income for the financial year Profit after tax attributable to: Equity holders of the Company Total comprehensive income attributable to Equity holders of the Company Baslediluted earnings per share on 44 40.784 90.001 52.215 51.835 51,339 50.107 52215 51.835 51330 90.191 51.335 51339 52.215 4.51 451 The accompanying accounting policies and explanatory to integral part of the financial statements TELEVEN MALAYSIA HOLDINGS BERHAD ANNUAL REPORT Statements of Financial Position as at 31 December 2017 Note Group 31 December 31 December 2016 RM 000 RM 000 Restated 2017 2016 RM 000 Restate 303.500 Assets Non-current assets Property, plant and equipment Investment property Intangible assets Other investments 10 350.404 400 35.290 1 386,103 318.801 400 55522 1 355.624 21 232 325191 Current assets Inventories Sundry receivables Tax recoverable Cash and bank balances 15 250.00 92.000 13.268 221,957 113.526 3,748 69,634 408.865 294,960 180.705 105.14 5.605 125.487 418.651 16 773.693 743.302 1,485,138 15 19 123.338 1361300 (190,625 (1.33.248 123.333 1.561.800 58.913) Total assets Equity and liabilities Equity attributable to equity holders of the Company Share capital Share premium Treasury shares Capital reorganisation deficit Assets evaluation reserve Retained profits Total equity Non-current liabilities Provisions Borrowings Deferred tax liability 21 22 (190,625) 11.30.248) 40,784 81.985 74,034 34.068 35,331 87 317 170.294 23 24 5.775 7.400 42.400 19.436 69,236 25 219 15.664 8008 8.790 14 700 Current liabilities Provisions Borrowings Trade payables Other payables Taxation 23 24 27 28 158 90.473 261506 701 1965 277 143,619 392.617 115.154 1 651,690 720.934 145.161 Total liabilities Total equity and liabilities 738352 773650 Se so 573 508 743.802 794968 The accompanying accounting policies and explanatory notes for an integral part of the financial statements TELEVEN WILAYA HOLDINGS BERHAD OVAL REPORT PIT Statements of Financial Position as at 31 December 2017 Note Company 2017 RM 000 2016 RMOOC 12 1.378,243 1378,248 Non-current assets Investments in subsidiary companies, representing total concurrent asset Current assets Sundry receivables Tax recoverable Cash and bank balances 15 16 55,090 1235 1,503 60,828 1.439,078 52.071 788 9,798 62.657 1.440.005 1.485,138 Total assets Equity and liability Equity atributable to equity holders of the Company Share capital Share premium Treasury shares Retained profes Total equity Current liability Other payables, representing total current ability Total equity and liability 19 22 (190,625) 60,998 1,355,511 123.338 1.361.800 (190,625) 61 351 1.355.864 83.565 1.439,076 85.041 1.440.005 The accompanying accounting policies and explanatory notes for an integral part of the financial statements TELEVEN MALAYSIA HOLDINGS SERANNUAL REPORT Statements of Changes in Equity for the Financial Year Ended 31 December 2017 Attributable to equlty holders of the Company Capital Asses Share Share Treasury reorganisation revaluation Retained capital premium deficit merve profita RM 000 RM 600 RM200 RM 600 RM 500 RM 500 (Note 17) (Note 18) (Note 19) (Note 20) (Note 21) (Note 22) Total equity RM 800 123.338 1361 800 58913) 12.343,245) 87217 170.14 133 133 (33) 100 87317 100 123.338 1.361.800 1589131 11.343.245) 52.215 52.215 Group At 1 January 2016 As previously stated Arising from change in accounting policy for Investment property (Notes 10 and 38) Lesenere (Notes 25 and 38) As restated a compreensive Income for the year Transactions with owners Acquisition of treasury shares (Note 19) Dividends on ordinary shares (Note 29) Total transactions with owners At 31 December 2016 Al 1 January 2017 As previously stated Arising from change in accounting policy for investment property (Notes 10 and 3) Less Deferred taxation (Notes 26 and 38) (139,712) (131.712) 55.466 55.456 (131 712) 55.455) S4066 123 338 1 361 800 11345 243) 35 331 123 338 1.361.800 (190.005) 1363.245 33.24 35.100 45 (190.625 11.343.245) 8406 35.331 40.784 50.107 90,001 As restated 123.338 1.361.800 Transfer pursuant to Section 61862) Companies Act 2016 1,361.000 (1,361.800) Total comprehensive Income for the year Transactions with owne Dividends on ordinary shares (Note 29 representing total transaction with owners At 31 December 2017 1,485,138 Distributable 152188 81,985 (1,343240 40,784 74.034 TELEVEN MALAYSIA HOLDINGS BERHADIAL REPORT 2007 Statements of Changes in Equity for the Financial Year Ended 31 December 2017 Attributable to equity holders of the Company Share capital RMODO (Note 17) Share premium RMODO (Note 18) 1,361 300 Treasury shares RM 600 (Note 19) 55,913) Total guilty RM 600 Retained profits RM DOO (Note 22) 65.478 59.339 123 338 1.491,700 51 159 (151.7123 (131,7123 (55.46 (55,456 55.466) 123,338 Company At 1 January 2016 Total comprehensive income for the year Transactions with owners Acquisition of treasury shares (Note 10) Dividends on ordinary shares (Note 29) Total transactions with owners At 31 December 2016 At 1 January 2017 Transfer pursuant to Section 618/2) of Companies Act 2016 Total comprehensive income for the year Transactions with owners Dividends on ordinary shares (Note 29). representing total transaction with owners At 31 December 2017 Distributable 1,365,800 1,361,800 1131.712) 1190.525) (190,625) 61351 61351 1.355,254 1,355,854 123,338 1.361,800 11.361.800) 51.35 51.00 (52.168 1.355,511 1,485.138 1190.625) 60998 The accompanying accounting policies and explanatory notes for an integral part of the financial statements Statements of Cash Flows for the Financial Year Ended 31 December 2017 Group 2017 RM 000 2016 Company 2017 RM 000 RM 000 2016 RM 000 2.352.114 12.282,307) 69.107 (9.232) (11 527 2.231,168 12.135.137) 94981 12.590) (19.250) 10 (1,789) (1,779) (4.632) 489 14.350) (3,861) (1.448) (978) 1505 49,043 73.141 16,916) 16.287 (44560) (3.613) 165,712 (12.697) 282 15 (1,285) 52,000 94 89,124 70,000 800 888 1.750 Cash flows from operating activities Cash receipts from customer and other receivables Cash paid to suppliers and employees Cash generated from used in operations Interest paid Tax paid Not cash generated from(uted in) operating activities Cash flows from investing activities Purchase of property, plant and equipment Purchase of intangible assets Proceeds from disposal of property, plant and equipment Movement in intercompany balances Dividend income received Interest received Net cash (used in generated from investing activities Cash flows from financing activities Dividends paid on ordinary shares Acquisition of treasury shares Proceeds from banker's comptances Repayment of banker's acceptances Proceeds from revolving credit Proceeds from term loan Repayment of ferm loans Repayment of hire purchase and finance lease labies Net cash generated from used in financing activities Not Increase (decrease in cash and cash equivalents Cash and cash equivalents at 1 January Cash and cash equivalents at 31 December Note 16) (47,003) 50,809 159,924 (52.188 52,180) (55,466) (131.712) 330,820 (324.533) 40,000 32.000 (7.800) (55.486) (131.7121 225,653 (160.140) 20.000 30,000 (160) (1.899) 73.564) 18.139 (52,183) 187.178) 20,184 48.450 (77.037) 128.487 (8,295) 9,798 (33,541) 43.339 49.450 1,503 9,798 The accompanying accounting policies and explanatory notes for an integral part of the financial statements 1. turnover of total assets = Sales / Total Assets
2. time interest earned ratio = Income before interest and taxes / Interest expense
3. gross profit margin = Sales - The cost of goods sold / Sales
4. net profit margin = Net Profit / Sales x 100%
5. return on equity = Net Profit - Stock dividends mainly / Total equity x 100%
I NEED ANSWERS BY USING THE ABOVE FORMULATION by referring to the attached annual report. Thanks :)
Step by Step Solution
There are 3 Steps involved in it
Step: 1

Get Instant Access to Expert-Tailored Solutions
See step-by-step solutions with expert insights and AI powered tools for academic success
Step: 2

Step: 3
Ace Your Homework with AI
Get the answers you need in no time with our AI-driven, step-by-step assistance
Get Started
Cost Accounting A Managerial Emphasis
Authors: Charles T. Horngren
3rd Edition
0131800345, 978-0131800342