

Answered step by step
Verified Expert Solution
Question
1 Approved Answer
how to fix erroe on line 17 in code please!! assignment attached inport nunpy as ing import pandas as pd inpert seaboim as sns. import
how to fix erroe on line 17 in code please!! 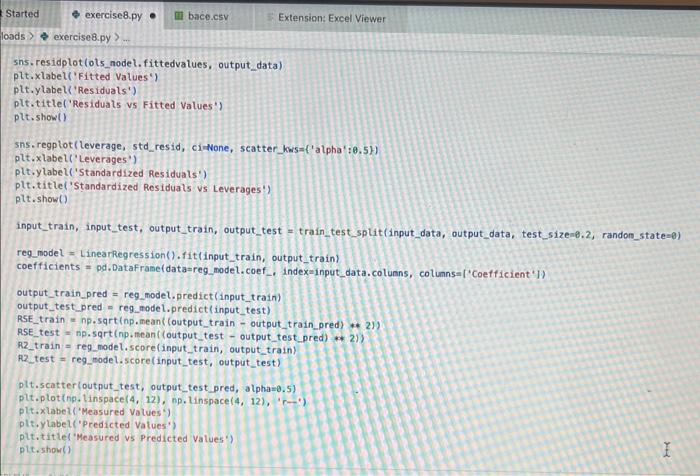
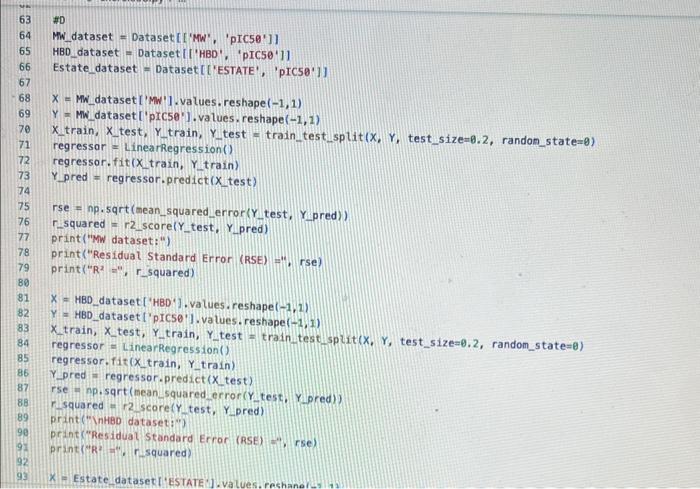
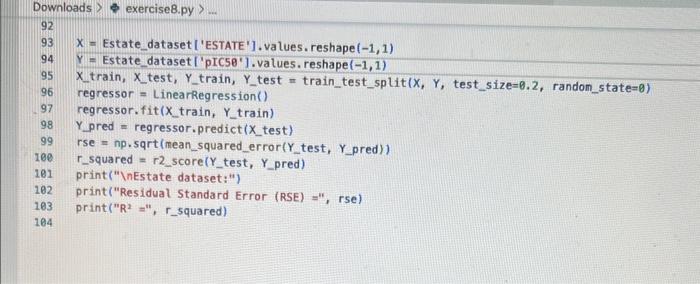
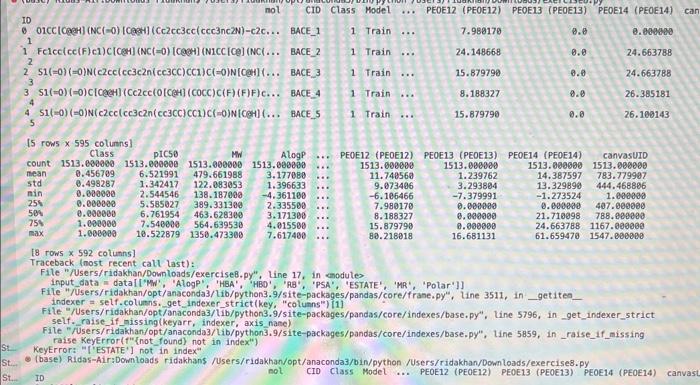


inport nunpy as ing import pandas as pd inpert seaboim as sns. import nstplot lib.pyplot as ptt: fron sklearn inport datapets fron sklearn, Linear nodel inport Linearflegressien fren sklearhinodel selection inport train_test,split. fron sklearn, netrics inport accuracy_score, nean_squared_error, r2_score fren xarray inport Dataset data = pd.read csv('bace, esv') Af. print(data.head(1) R print first 5 rows of dataset print(data. describel)) ' sumary statisties of dataset at. Inpot data = datall're', 'AlogP', 'PEA', 'HPO', 'RA', 'PSA', 'ESTATE', 'MR'. 'Polar'll output_data = data['ptcsa']. Mns+pbirplot (cataninput_data) plt, short) IC. inphrt statinodets, api as sa Input_dats = ss, add_constant (input_data) sls nodel = se, oss (output_data, input datal. fit() print (ols_nodel.suntary (1) residuats = ols_nodel resid std_resid = ols_nodel.getinf luence(3. resid_studentized internat. leverage = ots_nodet,opet_int luence(). hat_entrix_diap If rias a 508 coluanis! Tracestatk (mest recent call lait) ielf, rabe it unsunglkerarr. Indratr, an in nase Started exercise8.py e III bace.csv Extension: Excel Viewer loads > \& exercise8.py >. sns. residplot (ols_nodel. fittedvalues, output_data) plt.xlabel' ('itted Values') plt.ylabel('Residuals') plt.title( 'Residuals vs Fitted Values') plt.show() sns. regplot (Leverage, std_resid, ci=None, seatter_kws=\{ { alpha :.5}) plt. xlabel ( Leverages") plt.ylabel' ('standardized Residuats') plt. title ('standardized Residuats vs Leverages') plt.show() input_train,_input_test, output_train, output_test = train_test_split(input_data, output_data, test_sizeno.2, randon_state=0) req_model = LinearRegression(). fit(input_train, output_train) coefficients = pd. Dataframe(data=reg_model, coef,_index=input_data. colunns, colunnsa ['Coefficient']) output_train_pred = reg_model.predict (input_train) output_test_pred = reg_nodel. predict (input_test) RSE_train = np.sart (np.mean ( (output_train - output_train_pred) +i 21) ASE_test = np.sqrt (np. fican ( (output_test - output_test_pred) * 2)) R2_train = reg model. score(input_train, output_train) A2 _test = reg_model.score(input_test, output_test) plt.scatter(output_test, output_test_pred, atpha=0.5) plt. plot(np. tinspace (4,12),np.1 inspace(4, 12), 1r1) plt.xlabel( (Measured Vatues") plt. ylabel( "Predicted Vatues") plt.title('Measured vs Predicted Values') plt. show() input data = datal['MW', 'AlogP', 'HBA', 'HBO', 'R8', 'PSA', 'ESTATE', 'MR', 'Polar']] File "/Users/ridakhan/opt/anaconda3/lib/python3.9/site-packages/pandas/core/frane. py.". Line 3511. in .getiten _ indexer = self. colusns. get indexer_strict (key, "colunns") \{1] File -/Users/ridakhan/opt/anaconda3/1ib/python3.9/site-packages/pandas/core/indexes/base.py". Line 5796, in _get_indexer_strict self. raise_if missing(keyarr, indexer, axis nane) File "rusers/fidakhan/opt/anaconda3/Lib/python3.9/site-packages/pandas/core/indexes/base.py", Line 5859, in _raise_if_missing raise Keyerror(f" "not found) not in index") Keyerror: "['ESTATE'] not in index" - (base) Ridas-Air:Downloads ridakhans /Users/ridakhan/opt/anaconda3/bin/python /Users/ridakhan/Downloads/exercise8.py ID not CID Class Model ... PEOE12 (PEOE12) PEOE13 (PEOE13) PEOE14 (PEOE14) canvas Exercise set 8 1. The attached paper by Subramanian ot al. uses Quantitative Structure-Activity Relationship (QSAR) models using statistical approaches to estimate the binding affinities (IC50) for diverse structural and chemical classes of human -secretase 1 (BACE-1) inhibitors. Results are compared with values reported in literature. Govindan Subramanian, Bharath Ramsundar, Vijay Pande, and Rajiah Aldrin Denny, "Computational Modeling of -Secretase 1 (BACE-1) Inhibitors Using Ligand Based Approaches", Journal of Chemical Information and Modeling (2016), 56, 1936-1949. Use the scikit-leam methods to perform statistical analysis of the BACE dataset arid to predict the binding affinity. The dataset is provided within the exercise set. - import the required libraries and modules: numpy, matplotlib.pyplot, seabom, pandas, datasets and linear model from sklearn, LinearRegression from sklearn.linear_model, accuracy_score from sklearn.metrics, train_test_split from sklearn.model_selection - download the bace.csv dataset A. Read the dataset using pandas. Print information about the data contained in the dataset, such as the header, description or summary. B. Build a 9-feature input dataset using the following physical descriptors: molecular weight ('MW'), partition coefficient ('AlogP'), hydrogen bond acceptor ('HBA'), hydrogen bond donor ('HBD'), rotatable bonds ('RB'), polar surface area (PSA'), electrotopological states ('ESTATE'), molar refractivity ('MR'), molecular polarizability ('Polar'). Graph the dataset using a pair plot representation. C. Assign the measured value of the measured binding affinity ('piC50') to the output variable. - Use statsmodels ordinary least squares (OLS) regression model to perform a multiple linear regression of the binding affinity on the set of 9 predictors. Print the statistics using the summary table (use the summary() function in statsmodels). Determine the residuals, standardized (studentized) residuals, the leverages and plot the Residuals versus the fitted values and the Standardized Residuals versus the Leverages. What do these plots tell you? - Split the dataset into a training set, comprising 80% of the data randomly selected, and a test set, comprising the remaining 20% of the original data. - Perform a multiple linear regression of the training set of solubility on the training set of 9 predictors and determine the regression coefficients. - Assess the fit by obtaining the Residual Standard Error (RSE) and the R2 statistic for the training and the test sets. How do these values compare with the RMSE and R2 values in Table 2 of the Subramanian et al. paper? - Perform a simple linear regression of the test output variable on the predicted test values and illustrate the fitted line in a graph along with the scatter plot of the test and predicted test output data. the training and the teet sets. How de hese viues cer pare with the fusE and Rt values in Table 2 of the Subramanian of at peper? - Parform a simple linede rogressban of the test output vartable on the predicted test values and flustrate the fyled ine in a grech along with the satter plot of the test and poedieted teel oulfut data. D. Ceneeate an 3 single-feature dazasets by selecting enly the column WrN, er HED; or Filate' from the above set in pay B. - Petorer a single linear tegrbsion on eset of the single frature datarest utirg the approbich in part C. - How do the rests for each simgir ivear intrimen oampare weth the muligie lnear regression from part Cl assignment attached 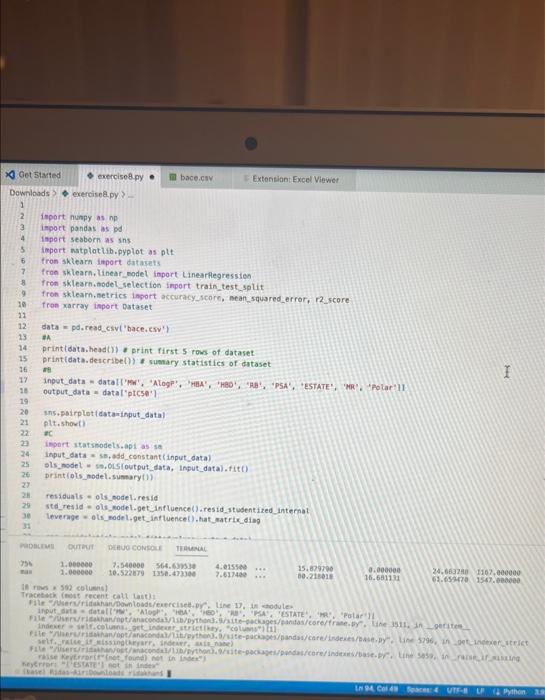
Step by Step Solution
There are 3 Steps involved in it
Step: 1

Get Instant Access to Expert-Tailored Solutions
See step-by-step solutions with expert insights and AI powered tools for academic success
Step: 2

Step: 3
Ace Your Homework with AI
Get the answers you need in no time with our AI-driven, step-by-step assistance
Get Started
Advances In Spatial And Temporal Databases 8th International Symposium Sstd 2003 Santorini Island Greece July 2003 Proceedings Lncs 2750
Authors: Thanasis Hadzilacos ,Yannis Manolopoulos ,John F. Roddick ,Yannis Theodoridis
2003rd Edition
3540405356, 978-3540405351