

Answered step by step
Verified Expert Solution
Question
1 Approved Answer
How to fix the attached error. Using the auto data set and using the scikit learn library 2 . Create and add a binary variable
How to fix the attached error.
Using the auto data set and using the scikit learn library
Create and add a binary variable column called mpghighlow to the dataset that is set to High if mpg is a value above and a Low if mpg is a value less than or equal to Make sure the mpghighlow column is of type category.
Check if the auto data is imbalanced with respect to mpghighlow. Report the percentage of the data that belong to the two classes High and Low
Split the dataset into training and test and use fold cross validation for the models below
Fit a logistic regression model to the training set to predict mpghighlow using all the other featuresvariables except mpg year, origin, and name. Predict the mpghighlow using the test dataset and report the Accuracy, Precision, Recall, Specificity, and F measure.
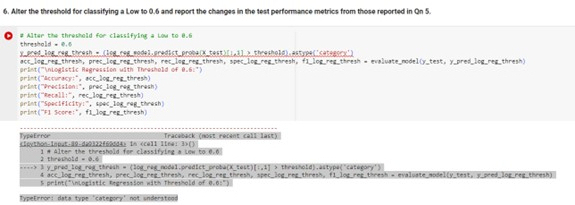
Alter the threshold for classifying a Low to and report the changes in the test performance metrics from those reported in Qn
Find the optimal threshold by drawing the ROC curve. Change the threshold to the optimal value you found from the ROC curve and report the changes in the test performance metrics from those reported in Qn
Fit a Nave Bayes model to the training data to predict mpghighlow using all the other featuresvariables except mpg year, origin, and name. Predict the mpghighlow using the test dataset. Plot the ROC curve and report the best threshold on the ROC curve plot. Report the AUC on the curve plot as well. Report the accuracy, precision, recall, specificity and F score.
Fit a KNN model to the training data to predict mpghighlow using all the other featuresvariables except mpg year, origin, and name. Use a grid search between and to find the best value of k Report the accuracy, precision, recall, specificity, F score and AUC.
Fit a LDA model to the training data to predict mpghighlow using all the other featuresvariables except mpg year, origin, and name. Report the accuracy, precision, recall, specificity and F score.
Summarize the performance of the all the above models by creating a dataframe with columns ModelName, Accuracy, Precision, Recall, Specificity, F Score. The data frame should contain one row for each model you built above with each of the columns filled in with the appropriate metric. Print out the dataframe. Which model performed the best from an accuracy point of view and which model performed best from a recall point of view without adjusting for the threshold?Alter the threshold for classifying a Low to and report the changes in the test performance metrics from those reported in On
O I Alar the threbheld for classlfyling a Lou to e
threshols es
pristMioglstic Ragresiton with Thwobheld of
print Accuracy: Asclogrez.thresh
oriatPrectisioni preclegrefthresh
print Recall: reclogreg, threnh
DypeError Tracabuck nowt recent call last
Alter the threshold fer classifying a tew to
Dbefrnor: dats 'vpe 'catesiry' not inserateas
Step by Step Solution
There are 3 Steps involved in it
Step: 1

Get Instant Access to Expert-Tailored Solutions
See step-by-step solutions with expert insights and AI powered tools for academic success
Step: 2

Step: 3
Ace Your Homework with AI
Get the answers you need in no time with our AI-driven, step-by-step assistance
Get Started
Professional Microsoft SQL Server 2012 Administration
Authors: Adam Jorgensen, Steven Wort
1st Edition
1118106881, 9781118106884