Answered step by step
Verified Expert Solution
Question
1 Approved Answer
How to Read Stock Market Reports O pen up the financial page of almost any newspaper, and you will see hundreds of rows of


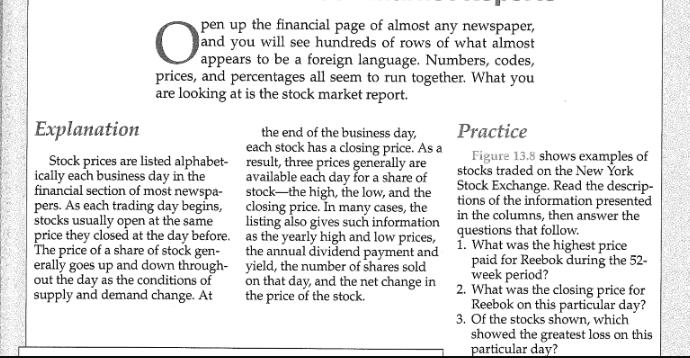
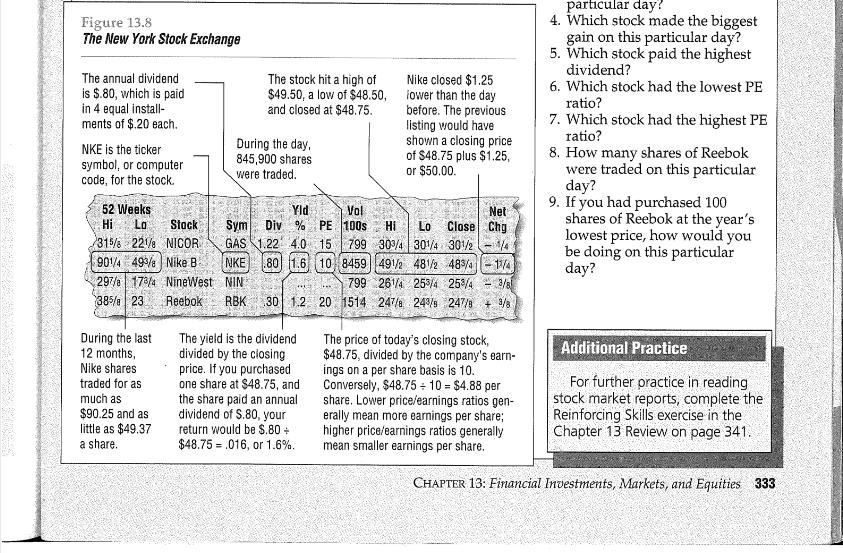
How to Read Stock Market Reports O pen up the financial page of almost any newspaper, and you will see hundreds of rows of what almost appears to be a foreign language. Numbers, codes, prices, and percentages all seem to run together. What you are looking at is the stock market report. Explanation Stock prices are listed alphabet- ically each business day in the financial section of most newspa- pers. As each trading day begins, stocks usually open at the same price they closed at the day before. The price of a share of stock gen- erally goes up and down through out the day as the conditions of supply and demand change. At the end of the business day, each stock has a closing price. As a result, three prices generally are available each day for a share of stock-the high, the low, and the closing price. In many cases, the listing also gives such information as the yearly high and low prices, the annual dividend payment and yield, the number of shares sold on that day, and the net change in the price of the stock. Practice Figure 13.8 shows examples of stocks traded on the New York Stock Exchange. Read the descrip- tions of the information presented in the columns, then answer the questions that follow. 1. What was the highest price paid for Reebok during the 52- week period? 2. What was the closing price for Reebok on this particular day? 3. Of the stocks shown, which showed the greatest loss on this particular day? Figure 13.8 The New York Stock Exchange The annual dividend is $.80, which is paid in 4 equal install- ments of $.20 each. NKE is the ticker symbol, or computer code, for the stock. During the last 12 months, Nike shares traded for as much as $90.25 and as little as $49.37 a share. The stock hit a high of $49.50, a low of $48.50, and closed at $48.75. 52 Weeks Yld Hi Lo Stock 315/8 221 NICOR 9014 498 Nike B Sym Div % PE GAS 1.22 4.0 15 NKE 80 1.6 10 297/a 17/4 Nine West NIN 38% 23 Reebok RBK During the day, 845,900 shares were traded. = Net Vol 100s Hi Lo Close Chg 799 30/4 301/4 30/2 15 1/4 8459 491/2 482 483/41 1/4 799 2614 25/4 25/4 3/8 30 1.2 20 1514 247/8 243/8 247/8 + 3/8 The yield is the dividend divided by the closing price. If you purchased one share at $48.75, and the share paid an annual dividend of S.80, your return would be $.80 + $48.75 .016, or 1.6%. Nike closed $1.25 lower than the day before. The previous listing would have shown a closing price of $48.75 plus $1.25, or $50.00. The price of today's closing stock, $48.75, divided by the company's earn- ings on a per share basis is 10. Conversely, $48.75 + 10 = $4.88 per share. Lower price/earnings ratios gen- erally mean more earnings per share; higher price/earnings ratios generally mean smaller earnings per share. particular day? 4. Which stock made the biggest gain on this particular day? 5. Which stock paid the highest dividend? 6. Which stock had the lowest PE ratio? 7. Which stock had the highest PE ratio? 8. How many shares of Reebok were traded on this particular day? 9. If you had purchased 100 shares of Reebok at the year's lowest price, how would you be doing on this particular day? Additional Practice For further practice in reading stock market reports, complete the Reinforcing Skills exercise in the Chapter 13 Review on page 341. CHAPTER 13: Financial Investments, Markets, and Equities 333
Step by Step Solution
There are 3 Steps involved in it
Step: 1
To answer the questions based on the information provided in the New York Stock Exchange table we wi...
Get Instant Access to Expert-Tailored Solutions
See step-by-step solutions with expert insights and AI powered tools for academic success
Step: 2

Step: 3

Ace Your Homework with AI
Get the answers you need in no time with our AI-driven, step-by-step assistance
Get Started


