Question
How to use Rstudio to solve these questions, thank you. 1.The following table gives the joint probability distribution between employment status and college graduation among
How to use Rstudio to solve these questions, thank you.
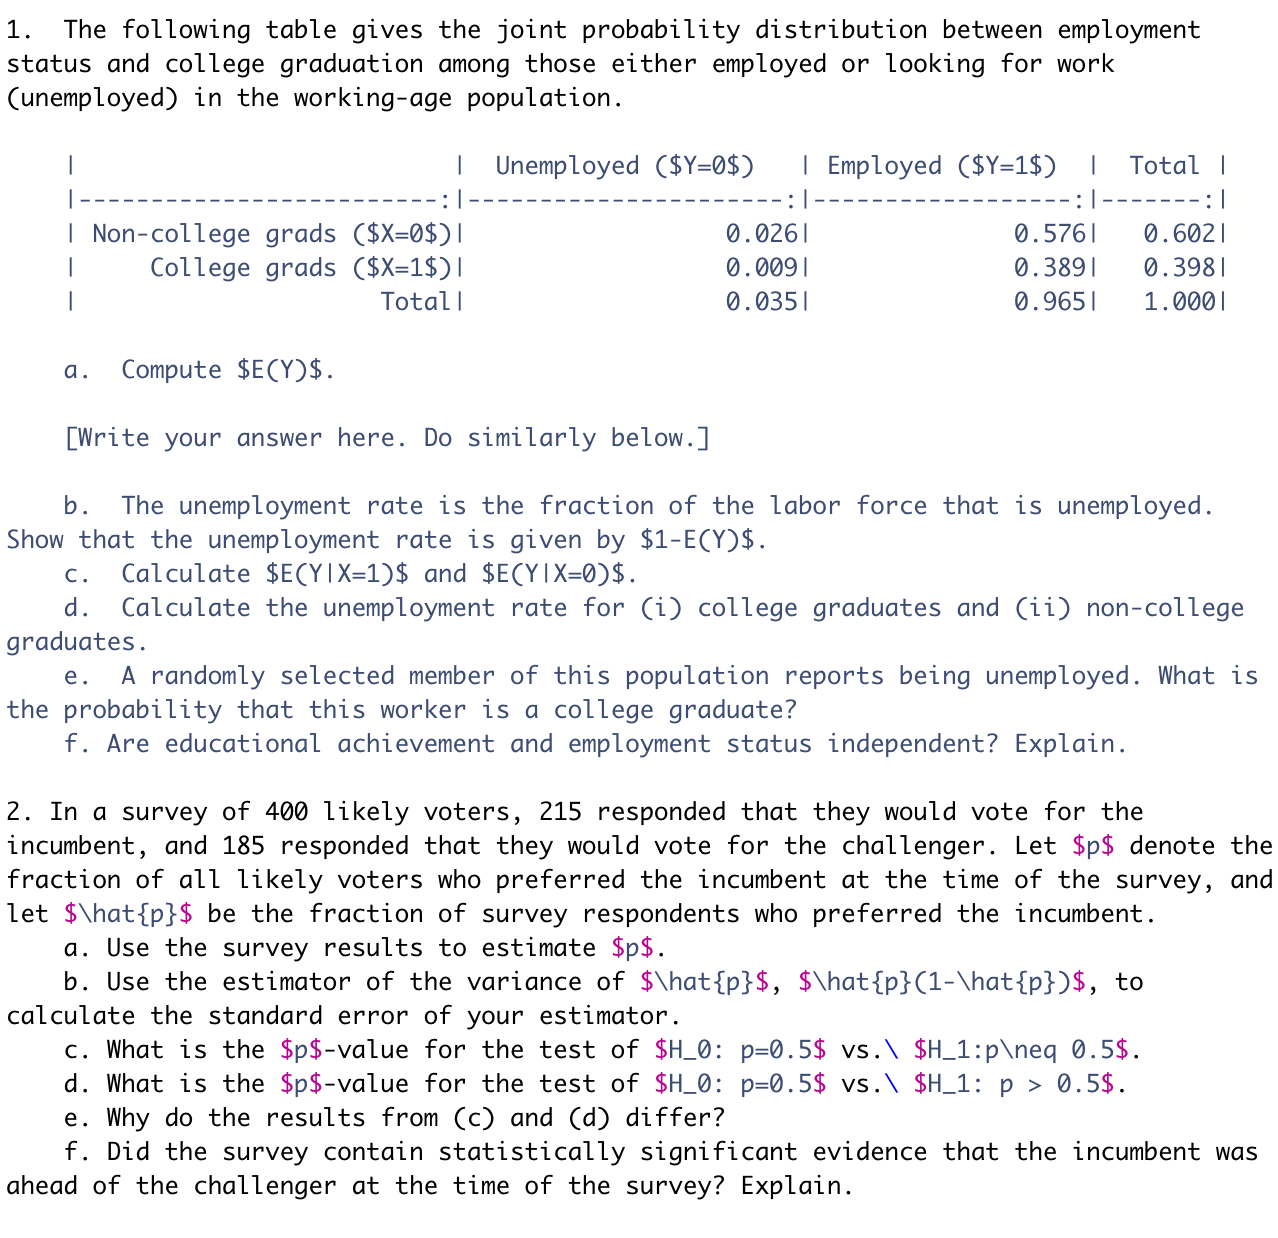
1.The following table gives the joint probability distribution between employment status and college graduation among those either employed or looking for work (unemployed) in the working-age population.
||Unemployed ($Y=0$)| Employed ($Y=1$)|Total |
|-------------------------:|----------------------:|------------------:|-------:|
| Non-college grads ($X=0$)|0.026|0.576|0.602|
|College grads ($X=1$)|0.009|0.389|0.398|
|Total|0.035|0.965|1.000|
a.Compute $E(Y)$.
[Write answer here. Do similarly below.]
b.The unemployment rate is the fraction of the labor force that is unemployed. Show that the unemployment rate is given by $1-E(Y)$.
c.Calculate $E(Y|X=1)$ and $E(Y|X=0)$.
d.Calculate the unemployment rate for (i) college graduates and (ii) non-college graduates.
e.A randomly selected member of this population reports being unemployed. What is the probability that this worker is a college graduate?
f. Are educational achievement and employment status independent? Explain.
2. In a survey of 400 likely voters, 215 responded that they would vote for the incumbent, and 185 responded that they would vote for the challenger. Let $p$ denote the fraction of all likely voters who preferred the incumbent at the time of the survey, and let $\hat{p}$ be the fraction of survey respondents who preferred the incumbent.
a. Use the survey results to estimate $p$.
b. Use the estimator of the variance of $\hat{p}$, $\hat{p}(1-\hat{p})$, to calculate the standard error of your estimator.
c. What is the $p$-value for the test of $H_0: p=0.5$ vs.\ $H_1:p eq 0.5$.
d. What is the $p$-value for the test of $H_0: p=0.5$ vs.\ $H_1: p > 0.5$.
e. Why do the results from (c) and (d) differ?
f. Did the survey contain statistically significant evidence that the incumbent was ahead of the challenger at the time of the survey? Explain.
4. We learned in class that $cov(X,Y)=0$ does not imply the independence of $X$ and $Y$.
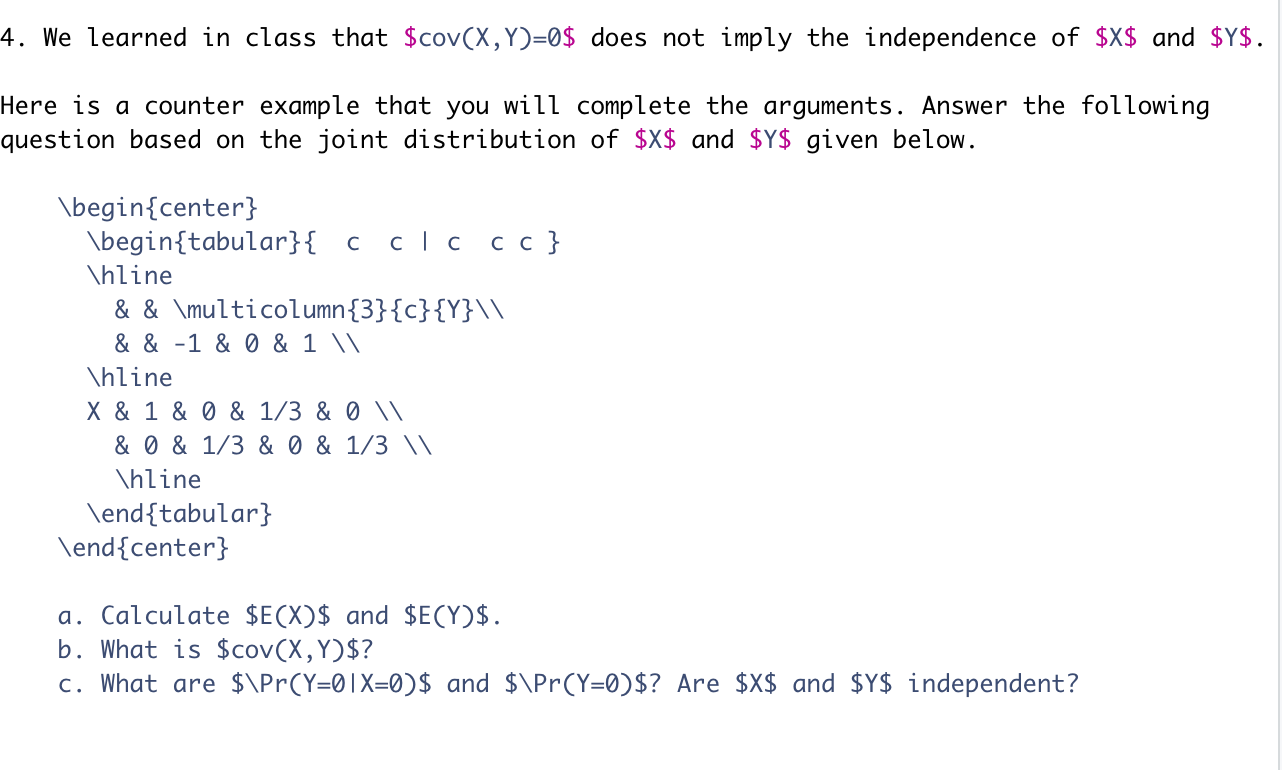
Here is a counter example that you will complete the arguments. Answer the following question based on the joint distribution of $X$ and $Y$ given below.
\begin{center}
\begin{tabular}{cc | cc c }
\hline
& & \multicolumn{3}{c}{Y}\\
& & -1 & 0 & 1 \\
\hline
X & 1 & 0 & 1/3 & 0 \\
& 0 & 1/3 & 0 & 1/3 \\
\hline
\end{tabular}
\end{center}
a. Calculate $E(X)$ and $E(Y)$.
b. What is $cov(X,Y)$?
c. What are $\Pr(Y=0|X=0)$ and $\Pr(Y=0)$? Are $X$ and $Y$ independent?


Step by Step Solution
There are 3 Steps involved in it
Step: 1

Get Instant Access to Expert-Tailored Solutions
See step-by-step solutions with expert insights and AI powered tools for academic success
Step: 2

Step: 3

Ace Your Homework with AI
Get the answers you need in no time with our AI-driven, step-by-step assistance
Get Started


