Answered step by step
Verified Expert Solution
Question
1 Approved Answer
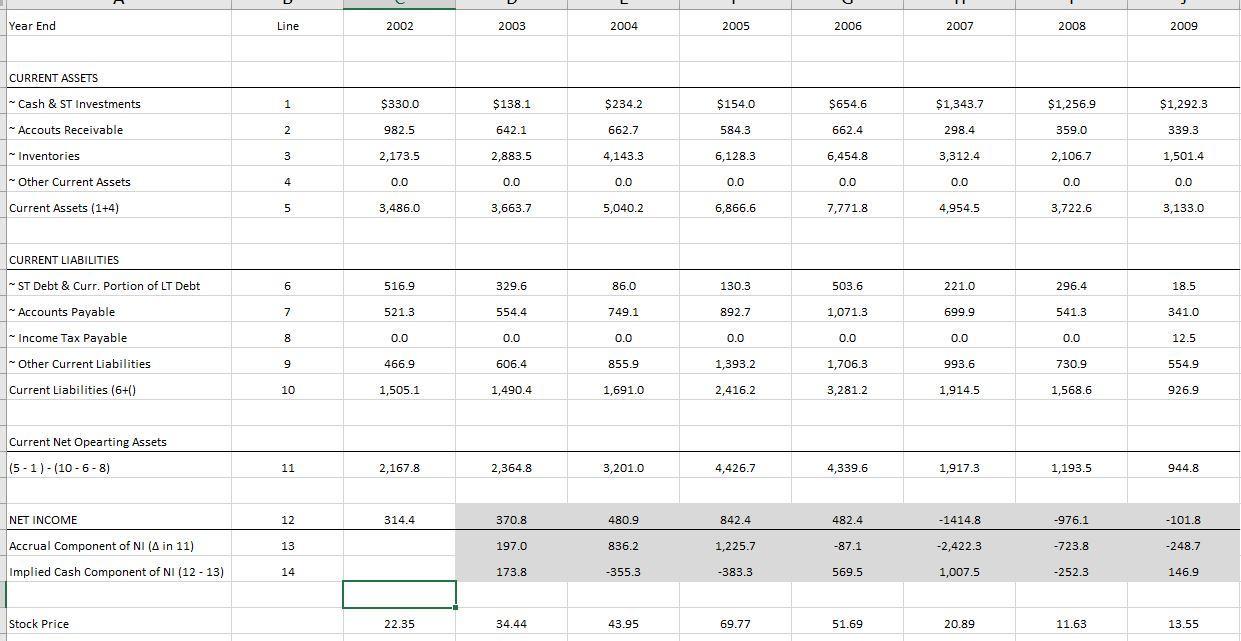
How would accounting information (using KB Home's inventory, earnings, cash flow, and stock price) have been used to predict the financial crisis of 2008. Year
How would accounting information (using KB Home's inventory, earnings, cash flow, and stock price) have been used to predict the financial crisis of 2008.

Year End CURRENT ASSETS ~Cash & ST Investments ~Accouts Receivable ~ Inventories ~Other Current Assets Current Assets (1+4) CURRENT LIABILITIES ~ST Debt & Curr. Portion of LT Debt ~Accounts Payable ~Income Tax Payable ~ Other Current Liabilities Current Liabilities (6+() Current Net Opearting Assets (5-1)-(10-6-8) NET INCOME Accrual Component of NI (A in 11) Implied Cash Component of NI (12-13) Stock Price H Line UAWN H 5 1000 og 6 7 8 9 10 11 12 13 14 2002 $330.0 982.5 2,173.5 0.0 3,486.0 516.9 521.3 0.0 466.9 1,505.1 2,167.8 314.4 22.35 2003 $138.1 642.1 2,883.5 0.0 3,663.7 329.6 554.4 0.0 606.4 1,490.4 2,364.8 370.8 197.0 173.8 34.44 2004 $234.2 662.7 4,143.3 0.0 5,040.2 86.0 749.1 0.0 855.9 1,691.0 3,201.0 480.9 836.2 -355.3 43.95 2005 $154.0 584.3 6,128.3 0.0 6,866.6 130.3 892.7 0.0 1,393.2 2,416.2 4,426.7 842.4 1,225.7 -383.3 69.77 2006 $654.6 662.4 6,454.8 0.0 7,771.8 503.6 1,071.3 0.0 1,706.3 3,281.2 4,339.6 482.4 -87.1 569.5 51.69 2007 $1,343.7 298.4 3,312.4 0.0 4,954.5 221.0 699.9 0.0 993.6 1,914.5 1,917.3 -1414.8 -2,422.3 1,007.5 20.89 2008 $1,256.9 359.0 2,106.7 0.0 3,722.6 296.4 541.3 0.0 730.9 1,568.6 1,193.5 -976.1 -723.8 -252.3 11.63 2009 $1,292.3 339.3 1,501.4 0.0 3,133.0 18.5 341.0 12.5 554.9 926.9 944.8 -101.8 -248.7 146.9 13.55 Year End CURRENT ASSETS ~Cash & ST Investments ~Accouts Receivable ~ Inventories ~Other Current Assets Current Assets (1+4) CURRENT LIABILITIES ~ST Debt & Curr. Portion of LT Debt ~Accounts Payable ~Income Tax Payable ~ Other Current Liabilities Current Liabilities (6+() Current Net Opearting Assets (5-1)-(10-6-8) NET INCOME Accrual Component of NI (A in 11) Implied Cash Component of NI (12-13) Stock Price H Line UAWN H 5 1000 og 6 7 8 9 10 11 12 13 14 2002 $330.0 982.5 2,173.5 0.0 3,486.0 516.9 521.3 0.0 466.9 1,505.1 2,167.8 314.4 22.35 2003 $138.1 642.1 2,883.5 0.0 3,663.7 329.6 554.4 0.0 606.4 1,490.4 2,364.8 370.8 197.0 173.8 34.44 2004 $234.2 662.7 4,143.3 0.0 5,040.2 86.0 749.1 0.0 855.9 1,691.0 3,201.0 480.9 836.2 -355.3 43.95 2005 $154.0 584.3 6,128.3 0.0 6,866.6 130.3 892.7 0.0 1,393.2 2,416.2 4,426.7 842.4 1,225.7 -383.3 69.77 2006 $654.6 662.4 6,454.8 0.0 7,771.8 503.6 1,071.3 0.0 1,706.3 3,281.2 4,339.6 482.4 -87.1 569.5 51.69 2007 $1,343.7 298.4 3,312.4 0.0 4,954.5 221.0 699.9 0.0 993.6 1,914.5 1,917.3 -1414.8 -2,422.3 1,007.5 20.89 2008 $1,256.9 359.0 2,106.7 0.0 3,722.6 296.4 541.3 0.0 730.9 1,568.6 1,193.5 -976.1 -723.8 -252.3 11.63 2009 $1,292.3 339.3 1,501.4 0.0 3,133.0 18.5 341.0 12.5 554.9 926.9 944.8 -101.8 -248.7 146.9 13.55 Year End CURRENT ASSETS ~Cash & ST Investments ~Accouts Receivable ~ Inventories ~Other Current Assets Current Assets (1+4) CURRENT LIABILITIES ~ST Debt & Curr. Portion of LT Debt ~Accounts Payable ~Income Tax Payable ~ Other Current Liabilities Current Liabilities (6+() Current Net Opearting Assets (5-1)-(10-6-8) NET INCOME Accrual Component of NI (A in 11) Implied Cash Component of NI (12-13) Stock Price H Line UAWN H 5 1000 og 6 7 8 9 10 11 12 13 14 2002 $330.0 982.5 2,173.5 0.0 3,486.0 516.9 521.3 0.0 466.9 1,505.1 2,167.8 314.4 22.35 2003 $138.1 642.1 2,883.5 0.0 3,663.7 329.6 554.4 0.0 606.4 1,490.4 2,364.8 370.8 197.0 173.8 34.44 2004 $234.2 662.7 4,143.3 0.0 5,040.2 86.0 749.1 0.0 855.9 1,691.0 3,201.0 480.9 836.2 -355.3 43.95 2005 $154.0 584.3 6,128.3 0.0 6,866.6 130.3 892.7 0.0 1,393.2 2,416.2 4,426.7 842.4 1,225.7 -383.3 69.77 2006 $654.6 662.4 6,454.8 0.0 7,771.8 503.6 1,071.3 0.0 1,706.3 3,281.2 4,339.6 482.4 -87.1 569.5 51.69 2007 $1,343.7 298.4 3,312.4 0.0 4,954.5 221.0 699.9 0.0 993.6 1,914.5 1,917.3 -1414.8 -2,422.3 1,007.5 20.89 2008 $1,256.9 359.0 2,106.7 0.0 3,722.6 296.4 541.3 0.0 730.9 1,568.6 1,193.5 -976.1 -723.8 -252.3 11.63 2009 $1,292.3 339.3 1,501.4 0.0 3,133.0 18.5 341.0 12.5 554.9 926.9 944.8 -101.8 -248.7 146.9 13.55
Step by Step Solution
★★★★★
3.38 Rating (154 Votes )
There are 3 Steps involved in it
Step: 1
How would accounting information using KB Homes inventory earnings cash flow and stock price have be...
Get Instant Access to Expert-Tailored Solutions
See step-by-step solutions with expert insights and AI powered tools for academic success
Step: 2

Step: 3

Ace Your Homework with AI
Get the answers you need in no time with our AI-driven, step-by-step assistance
Get Started


