

Answered step by step
Verified Expert Solution
Question
1 Approved Answer
How would i create a balance sheet to demonstrate sells from 2021 to 2023? CERAMIC STRUCTURES ENGINEERING, INC. BALANCE SHEETS AT DECEMBER 31. 2016 2012
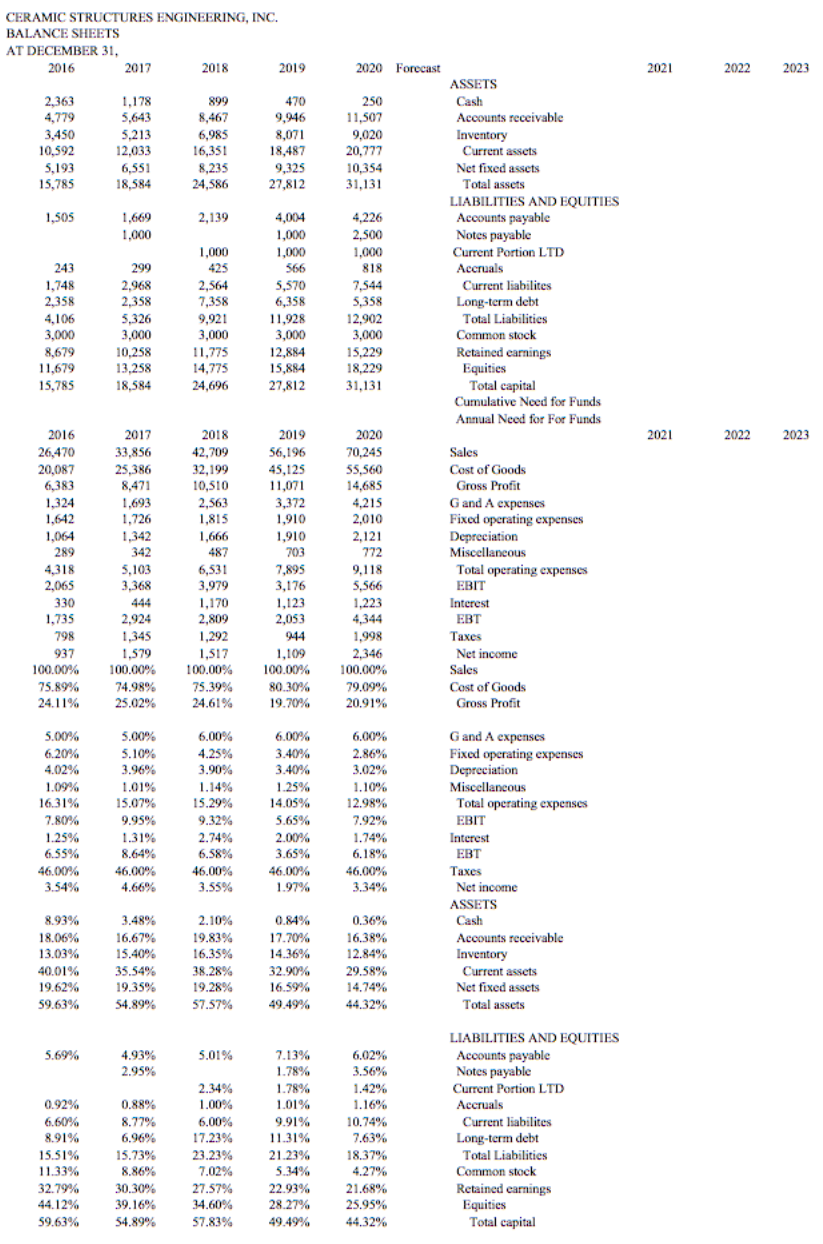
How would i create a balance sheet to demonstrate sells from 2021 to 2023?
CERAMIC STRUCTURES ENGINEERING, INC. BALANCE SHEETS AT DECEMBER 31. 2016 2012 2018 2019 2020 Forecast 2021 2022 2023 2,363 4,779 3,450 10,592 5,193 15,785 1,178 5.643 5.213 12,033 6,551 18,584 899 8,467 6,985 16,351 8,235 24,586 470 9.946 8,071 18,487 9,325 27,812 250 11,507 9,020 20.772 10,354 31,131 1,505 2,139 4,004 1.669 1.000 243 1,748 2,358 4,106 3,000 8,679 11,679 15,785 1,000 425 2,564 7,358 9,921 3,000 11,775 14,775 299 2,968 2,358 5,326 3,000 10,258 13,258 18,584 ASSETS Cash Accounts receivable Inventory Current assets Net fixed assets Total assets LIABILITIES AND EQUITIES Accounts payable Notes payable Current Portion LTD Accruals Current liabilites Long-term debt Total Liabilities Common stock Retained earnings Equities Total capital Cumulative Need for Funds Annual Need for For Funds 1,000 1,000 566 5,570 6,358 11,928 3,000 12,884 15,884 27,812 4,226 2.500 1,000 818 7,544 5.358 12,902 3.000 15,229 18,229 31,131 24,696 2021 2022 2023 2016 26,470 20.087 6,383 1.324 1,642 1.064 289 4318 2,065 330 1,735 798 937 100.00% 75.89% 24.11% 2017 33.856 25,386 8,471 1.693 1.726 1,342 342 5,103 3,368 444 2,924 1,345 1,579 100.00% 2018 42,709 32,199 10,510 2.563 1,815 1,666 487 6,531 3,979 1,170 2,809 1,292 1,517 100.00% 75.39% 24.61% 2019 56,196 45,125 11,071 3,372 1,910 1,910 703 7,895 3,176 1,123 2,053 944 1,109 100.00% 80.30% 19.70% 2020 70,245 55,560 14,685 4.215 2,010 2.121 772 9.118 5,566 1.223 4,344 Sales Cost of Goods Gross Profit G and A expenses Fixed operating expenses Depreciation Miscellaneous Total operating expenses EBIT Interest 1,998 EBT Taxes Net income Sales Cost of Goods Gross Profit 2,346 100.00% 79.09% 20.91% 74.98% 25.02% 5.00% 6.20% 4.02% 1.09% 16.31% 7.80% 1.25% 6.55% 46.00% 3.54% 5.00% 5.10% 3.96% 1.01% 15.07% 9.95% 1.31% 8.64% 46.00% 4.66% 6.00% 4.25% 3.90% 1.14% 15.29% 9.32% 2.74% 6.58% 46.00% 3.55% 6.00% 3.40% 3.40% 1.25% 14.05% 5.65% 2.00% 3.65% 46.00% 1.97% 6,00% 2.86% 3.02% 1.10% 12.98% 7.92% 1.74% 6.18% 46.00% 3.34% G and A expenses Fixed operating expenses Depreciation Miscellaneous Total operating expenses EBIT Interest EBT Taxes Net income ASSETS Cash Accounts receivable Inventory Current assets Net fixed assets Total assets 8.93% 0.84% 17.70% 18.06% 13.03% 40.01% 19.62% 59.63% 3.48% 16.67% 15.40% 35.54% 19.35% 54.89% 2.10% 19.83% 16.35% 38.28% 19.28% 57.57% 14.36% 32.90% 16.59% 49.49% 0.36% 16.38% 12.84% 29.58% 14.74% 44.32% 5.69% 5.01% 4.93% 2.95% 2.34% 1.00% 6.00% 0.92% 6.60% 8.91% 15.51% 11.33% 32.79% 44.12% 59.63% 0.88% 8.77% 6.96% 15.73% 8.86% 30.30% 39.16% 54.89% 17.23% 23.23% 7.02% 27.57% 34.60% 57.83% 7.13% 1.78% 1.78% 1.01% 9.91% 11.31% 21.23% 5.34% 22.93% 28.27% 49.49% 6.02% 3.56% 1.42% 1.16% 10.74% 7.63% 18.37% 4.27% 21.68% 25.95% 44.32% LIABILITIES AND EQUITIES Accounts payable Notes payable Current Portion LTD Accruals Current liabilites Long-term debt Total Liabilities Common stock Retained earnings Equities Total capital CERAMIC STRUCTURES ENGINEERING, INC. BALANCE SHEETS AT DECEMBER 31. 2016 2012 2018 2019 2020 Forecast 2021 2022 2023 2,363 4,779 3,450 10,592 5,193 15,785 1,178 5.643 5.213 12,033 6,551 18,584 899 8,467 6,985 16,351 8,235 24,586 470 9.946 8,071 18,487 9,325 27,812 250 11,507 9,020 20.772 10,354 31,131 1,505 2,139 4,004 1.669 1.000 243 1,748 2,358 4,106 3,000 8,679 11,679 15,785 1,000 425 2,564 7,358 9,921 3,000 11,775 14,775 299 2,968 2,358 5,326 3,000 10,258 13,258 18,584 ASSETS Cash Accounts receivable Inventory Current assets Net fixed assets Total assets LIABILITIES AND EQUITIES Accounts payable Notes payable Current Portion LTD Accruals Current liabilites Long-term debt Total Liabilities Common stock Retained earnings Equities Total capital Cumulative Need for Funds Annual Need for For Funds 1,000 1,000 566 5,570 6,358 11,928 3,000 12,884 15,884 27,812 4,226 2.500 1,000 818 7,544 5.358 12,902 3.000 15,229 18,229 31,131 24,696 2021 2022 2023 2016 26,470 20.087 6,383 1.324 1,642 1.064 289 4318 2,065 330 1,735 798 937 100.00% 75.89% 24.11% 2017 33.856 25,386 8,471 1.693 1.726 1,342 342 5,103 3,368 444 2,924 1,345 1,579 100.00% 2018 42,709 32,199 10,510 2.563 1,815 1,666 487 6,531 3,979 1,170 2,809 1,292 1,517 100.00% 75.39% 24.61% 2019 56,196 45,125 11,071 3,372 1,910 1,910 703 7,895 3,176 1,123 2,053 944 1,109 100.00% 80.30% 19.70% 2020 70,245 55,560 14,685 4.215 2,010 2.121 772 9.118 5,566 1.223 4,344 Sales Cost of Goods Gross Profit G and A expenses Fixed operating expenses Depreciation Miscellaneous Total operating expenses EBIT Interest 1,998 EBT Taxes Net income Sales Cost of Goods Gross Profit 2,346 100.00% 79.09% 20.91% 74.98% 25.02% 5.00% 6.20% 4.02% 1.09% 16.31% 7.80% 1.25% 6.55% 46.00% 3.54% 5.00% 5.10% 3.96% 1.01% 15.07% 9.95% 1.31% 8.64% 46.00% 4.66% 6.00% 4.25% 3.90% 1.14% 15.29% 9.32% 2.74% 6.58% 46.00% 3.55% 6.00% 3.40% 3.40% 1.25% 14.05% 5.65% 2.00% 3.65% 46.00% 1.97% 6,00% 2.86% 3.02% 1.10% 12.98% 7.92% 1.74% 6.18% 46.00% 3.34% G and A expenses Fixed operating expenses Depreciation Miscellaneous Total operating expenses EBIT Interest EBT Taxes Net income ASSETS Cash Accounts receivable Inventory Current assets Net fixed assets Total assets 8.93% 0.84% 17.70% 18.06% 13.03% 40.01% 19.62% 59.63% 3.48% 16.67% 15.40% 35.54% 19.35% 54.89% 2.10% 19.83% 16.35% 38.28% 19.28% 57.57% 14.36% 32.90% 16.59% 49.49% 0.36% 16.38% 12.84% 29.58% 14.74% 44.32% 5.69% 5.01% 4.93% 2.95% 2.34% 1.00% 6.00% 0.92% 6.60% 8.91% 15.51% 11.33% 32.79% 44.12% 59.63% 0.88% 8.77% 6.96% 15.73% 8.86% 30.30% 39.16% 54.89% 17.23% 23.23% 7.02% 27.57% 34.60% 57.83% 7.13% 1.78% 1.78% 1.01% 9.91% 11.31% 21.23% 5.34% 22.93% 28.27% 49.49% 6.02% 3.56% 1.42% 1.16% 10.74% 7.63% 18.37% 4.27% 21.68% 25.95% 44.32% LIABILITIES AND EQUITIES Accounts payable Notes payable Current Portion LTD Accruals Current liabilites Long-term debt Total Liabilities Common stock Retained earnings Equities Total capitalStep by Step Solution
There are 3 Steps involved in it
Step: 1

Get Instant Access to Expert-Tailored Solutions
See step-by-step solutions with expert insights and AI powered tools for academic success
Step: 2

Step: 3
Ace Your Homework with AI
Get the answers you need in no time with our AI-driven, step-by-step assistance
Get Started
Public Finance In Canada
Authors: Harvey S. Rosen, Wen, Snoddon
4th Canadian Edition
0070071837, 978-0070071834