

Question
How would you do this in R? I created a sample using rep_len() for each specified color and number of marbles then combined them into
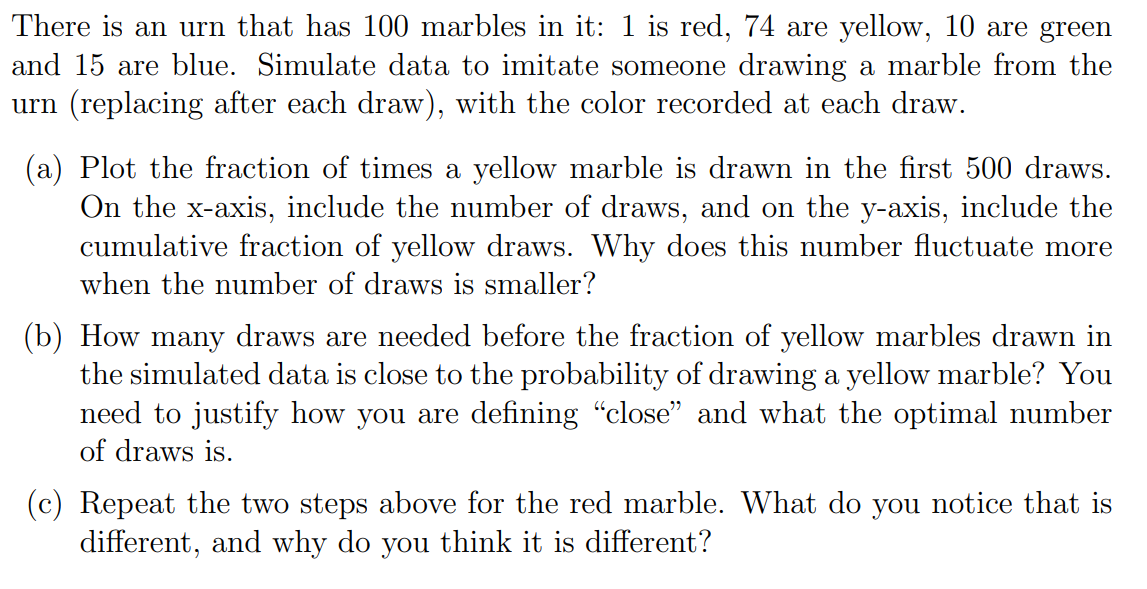 How would you do this in R? I created a sample using rep_len() for each specified color and number of marbles then combined them into one vector and created a sample set using sample() but I can't figure out how to plot them as asked
Step by Step Solution
There are 3 Steps involved in it
Step: 1

Get Instant Access to Expert-Tailored Solutions
See step-by-step solutions with expert insights and AI powered tools for academic success
Step: 2

Step: 3
Ace Your Homework with AI
Get the answers you need in no time with our AI-driven, step-by-step assistance
Get Started
Data Analysis In Microsoft Excel
Authors: Alex Holloway
1st Edition
B0CCCPKTTX, 979-8852388452