Answered step by step
Verified Expert Solution
Question
1 Approved Answer
https://docs.google.com/spreadsheets/d/1-dm54Iv_UfKoRdSzoR_3b-iGSY7g6RAbvyMaj1X9F8E/edit Volume, price per case, variable cost per case and total fixed costs are specified as numerical values. All other elements of the income statement

 https://docs.google.com/spreadsheets/d/1-dm54Iv_UfKoRdSzoR_3b-iGSY7g6RAbvyMaj1X9F8E/edit
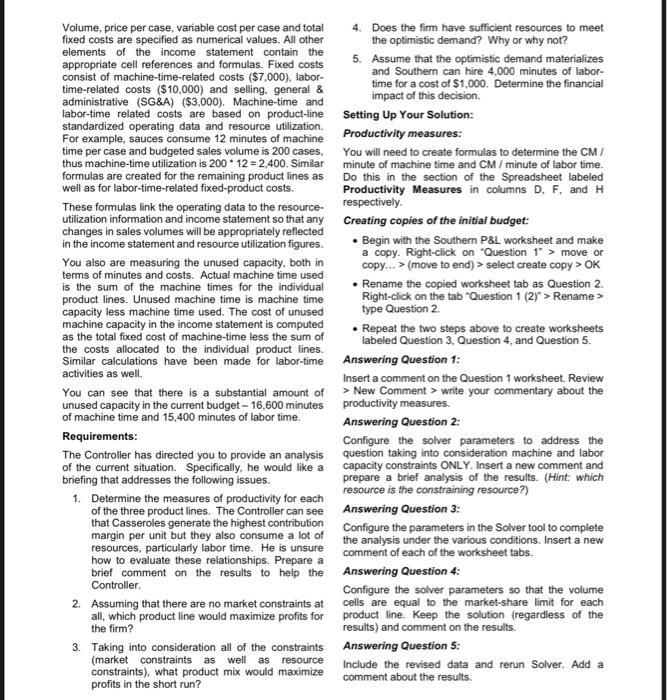
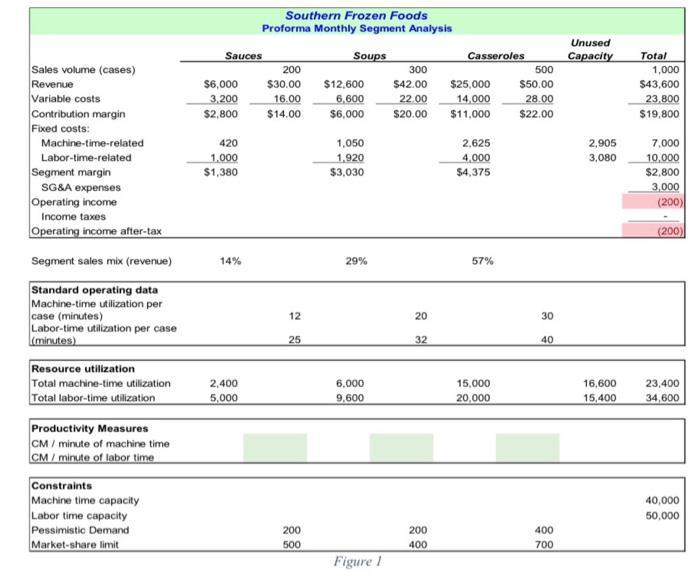
Volume, price per case, variable cost per case and total fixed costs are specified as numerical values. All other elements of the income statement contain the appropriate cell references and formulas. Fixed costs consist of machine-time-related costs ($7,000), labor- time-related costs ($10,000) and selling, general & administrative (SG&A) ($3,000). Machine-time and labor-time related costs are based on product-line standardized operating data and resource utilization. For example, sauces consume 12 minutes of machine time per case and budgeted sales volume is 200 cases, thus machine-time utilization is 200 * 12=2,400. Similar formulas are created for the remaining product lines as well as for labor-time-related fixed-product costs. These formulas link the operating data to the resource- utilization information and income statement so that any changes in sales volumes will be appropriately reflected in the income statement and resource utilization figures. You also are measuring the unused capacity, both in terms of minutes and costs. Actual machine time used is the sum of the machine times for the individual product lines. Unused machine time is machine time capacity less machine time used. The cost of unused machine capacity in the income statement is computed as the total fixed cost of machine-time less the sum of the costs allocated to the individual product lines. Similar calculations have been made for labor-time activities as well. You can see that there is a substantial amount of unused capacity in the current budget-16,600 minutes of machine time and 15,400 minutes of labor time. Requirements: The Controller has directed you to provide an analysis of the current situation. Specifically, he would like a briefing that addresses the following issues. 1. Determine the measures of productivity for each of the three product lines. The Controller can see that Casseroles generate the highest contribution margin per unit but they also consume a lot of resources, particularly labor time. He is unsure how to evaluate these relationships. Prepare a brief comment on the results to help the Controller. 2. Assuming that there are no market constraints at all, which product line would maximize profits for the firm? 3. Taking into consideration all of the constraints (market constraints as well as resource constraints), what product mix would maximize profits in the short run? 4. Does the firm have sufficient resources to meet the optimistic demand? Why or why not? 5. Assume that the optimistic demand materializes and Southern can hire 4,000 minutes of labor- time for a cost of $1,000. Determine the financial impact of this decision. Setting Up Your Solution: Productivity measures: You will need to create formulas to determine the CM / minute of machine time and CM / minute of labor time. Do this in the section of the Spreadsheet labeled Productivity Measures in columns D. F. and H respectively. Creating copies of the initial budget: Begin with the Southern P&L worksheet and make a copy. Right-click on "Question1"> move or copy... > (move to end) > select create copy > OK . Rename the copied worksheet tab as Question 2. Right-click on the tab "Question 1 (2) > Rename > type Question 2. Repeat the two steps above to create worksheets labeled Question 3, Question 4, and Question 5. Answering Question 1: Insert a comment on the Question 1 worksheet. Review > New Comment > write your commentary about the productivity measures. Answering Question 2: Configure the solver parameters to address the question taking into consideration machine and labor capacity constraints ONLY. Insert a new comment and prepare a brief analysis of the results. (Hint: which resource is the constraining resource?) Answering Question 3: Configure the parameters in the Solver tool to complete the analysis under the various conditions. Insert a new comment of each of the worksheet tabs. Answering Question 4: Configure the solver parameters so that the volume cells are equal to the market-share limit for each product line. Keep the solution (regardless of the results) and comment on the results. Answering Question 5: Include the revised data and rerun Solver. Add a comment about the results.
Step by Step Solution
★★★★★
3.49 Rating (176 Votes )
There are 3 Steps involved in it
Step: 1
Question 1 Productivity Measures To evaluate the productivity of each product line we can calculate the contribution margin per minute of machine time ...
Get Instant Access to Expert-Tailored Solutions
See step-by-step solutions with expert insights and AI powered tools for academic success
Step: 2

Step: 3

Ace Your Homework with AI
Get the answers you need in no time with our AI-driven, step-by-step assistance
Get Started


