

Answered step by step
Verified Expert Solution
Question
1 Approved Answer
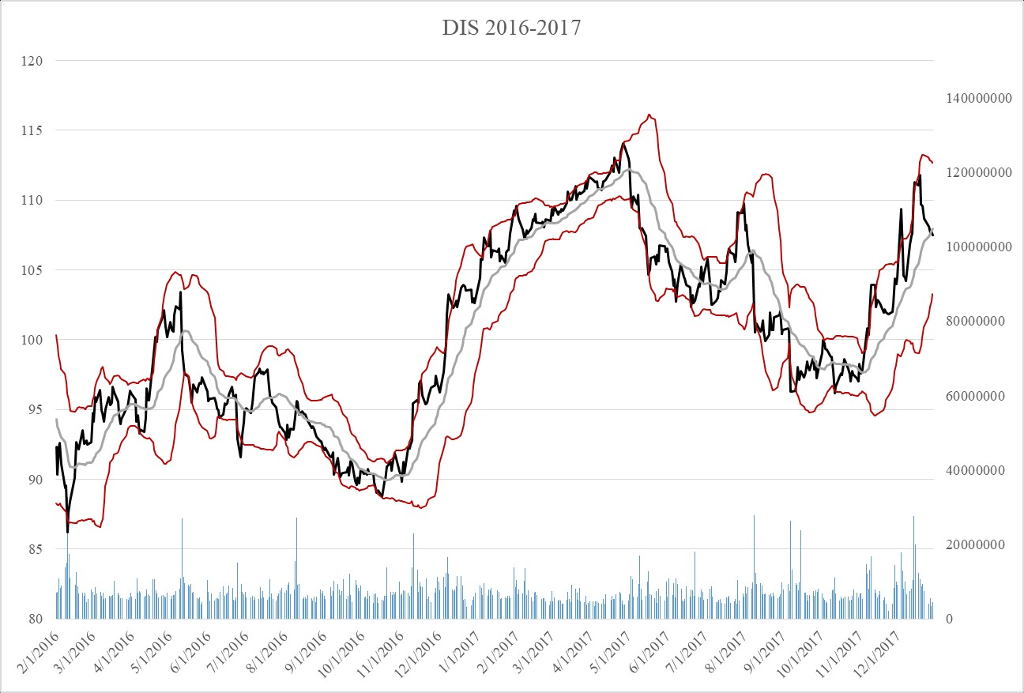
https://finance.yahoo.com/quote/DIS/history?period1=1451628000&period2=1514700000&interval=1d&filter=history&frequency=1d Please help with this question: Download the daily adjusted closing price and volume data for Disney stock (ticker DIS) for all of 2016 and
https://finance.yahoo.com/quote/DIS/history?period1=1451628000&period2=1514700000&interval=1d&filter=history&frequency=1d
Step by Step Solution
There are 3 Steps involved in it
Step: 1

Get Instant Access to Expert-Tailored Solutions
See step-by-step solutions with expert insights and AI powered tools for academic success
Step: 2

Step: 3
Ace Your Homework with AI
Get the answers you need in no time with our AI-driven, step-by-step assistance
Get Started
A Financial Crisis Manual Reflections And The Road Ahead
Authors: Dimitrios D. Thomakos , Platon Monokroussos, Konstantinos I. Nikolopoulos
1st Edition