https://phet.colorado.edu/sims/html/charges-and-fields/latest/charges-and-fields_en.html
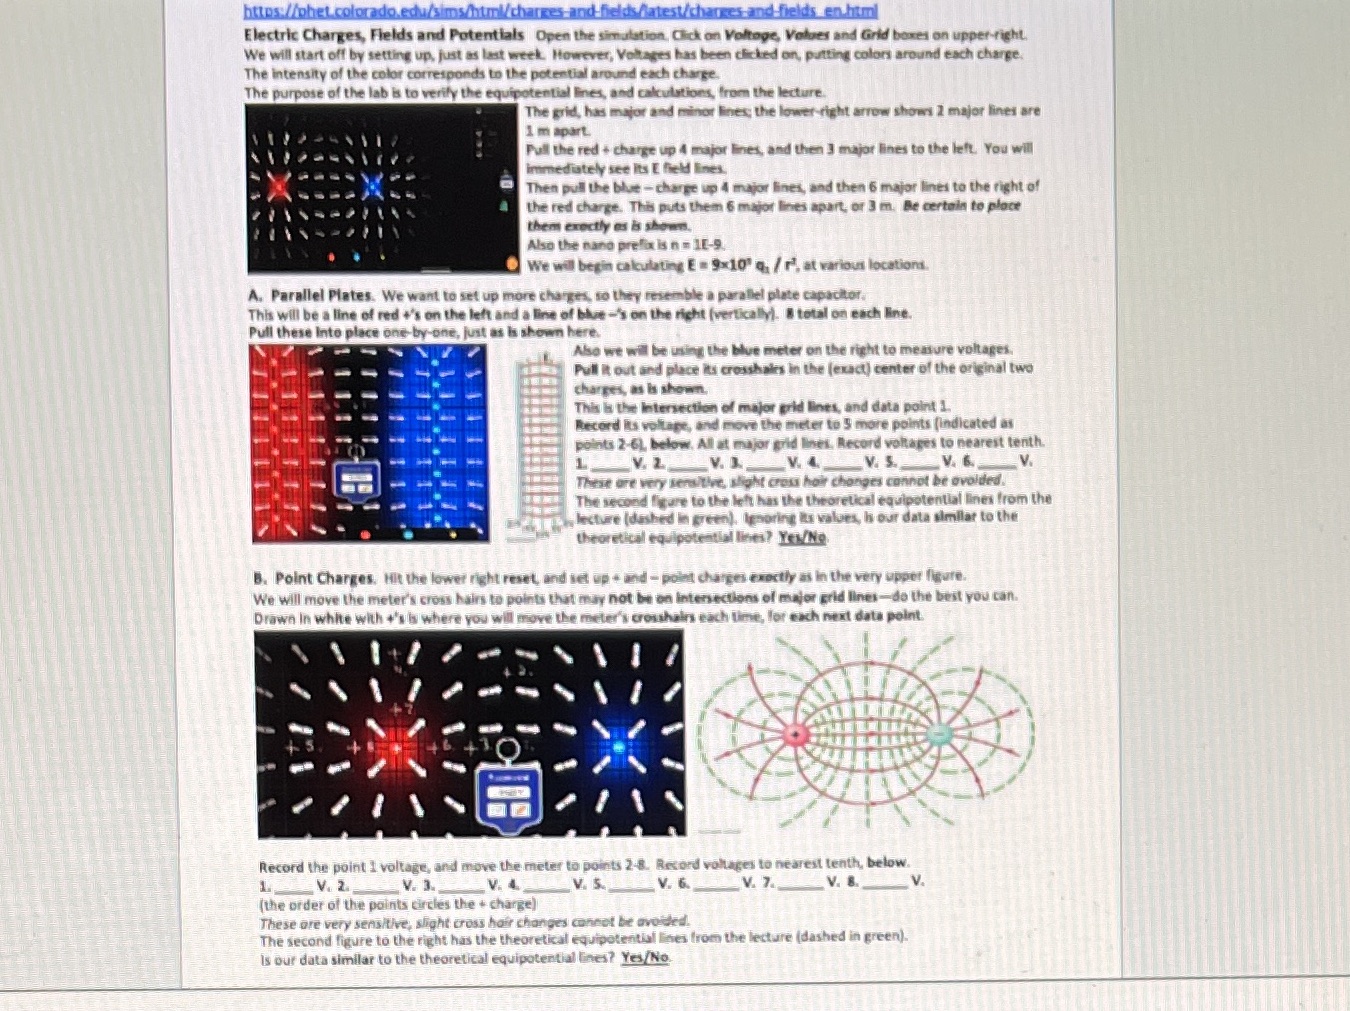
https://phet.colorado.edu/sims/html/charges-and fields./latest/charges.and fields_en.html Electric Charges, Fields and Potentials Open the simulation, Click on Voltage, Values and Grid boxes on upper-right We will start off by setting up, just as last week. However, Voltages has been clicked on, putting colors around each charge. The intensity of the color corresponds to the potential around each charge. The purpose of the lab is to verify the equipotential lines, and calculations, from the lecture. The grid, has major and minor lines; the lower right arrow shows 2 major lines are I'm apart. Pull the red + charge up 4 major lines, and then 3 major lines to the left. You will immediately see Its E field lines. Then pull the blue - charge up 4 major lines, and then 6 major lines to the right of the red charge. This puts them 6 major lines apart, or 3 m. Be certain to place them exectly as is shown. Also the hand prettis = 18-9. We will begin calculating E = 9x10' q, / r', at various locations A. Parallel Plates. We want to set up more charges, so they resemble a parallel plate capacitor. This will be a line of red +'s on the left and a line of blue -'s on the right (vertically). $ total on each line. Pull these Into place one-by-one, just as Is shown here. Also we will be using the blue meter on the right to measure voltages. Pull it out and place it's crosshairs in the (exact) center of the original two charges, as is shown, This is the Intersection of major grid lines, and data point 1. cord its voltage, and move the meter to 5 more points (indicated as oints 2-61, below. All at major grid lines. Record voltages to nearest tenth. V. Z LVL V. S. V. & V. These are very sera tive, slight cross hair changes cannot be avoided. The second figure to the left has the theoretical equipotential lines from the lecture (dashed in green), Ignoring Its values, h our data similar to the theoretical equipotential lines? New/Ne. B. Point Charges. Hit the lower right reset and set up + and - point charges exactly as in the very upper figure. We will move the meter's cross hairs to points that may not be on intersections of major grid lines-do the best you can. Drawn In white with +'s is where you will move the meter's crosshairs each time, for each next data point. Record the point 1 voltage, and move the meter to points 2-8. Record voltages to nearest tenth, below. V. 2.. V. 3. V. L V. 6. V. 7. V. B. V. ( the order of the points circles the + charge) These are very sensitive, slight cross hair changes cannot be avoided. The second figure to the right has the theoretical equipotential lines from the lecture (dashed in green). is our data similar to the theoretical equipotential lines? Yes/No


