https://www.sec.gov/Archives/edgar/data/1531152/000153115220000014/bj-20200201x10k.htm#s2C8DAC11A39F555A83D201C132A4AFD2
https://www.morningstar.com/stocks/xnys/bj/financials
https://www.sec.gov/ix?doc=/Archives/edgar/data/909832/000090983220000017/cost-20200830.htm#id2c7a27cc45a4341a7bdf88b9739d38b_73
https://www.morningstar.com/stocks/xnas/cost/valuation
Copy and paste each url above to review the 10K for BJs and COSTCO.
Are the highlighted values correct? For the ones missing values, please provide value and explanation of how. Please provide missing analysis of each line
What would be the industry & index? Industry Ratios: In order to analyze ratios for the companies, you need to obtain the ratios for the Industry the competitors operate in. Industry values for the ratios can be found in the index column of the Morningstar Valuation page. If no index value is available, put the five-year averages for both companies in the industry column and use these figures for the industry comparison of your ratio analysis
Based on the ratio analysis above, in which company would you be willing to invest and why?
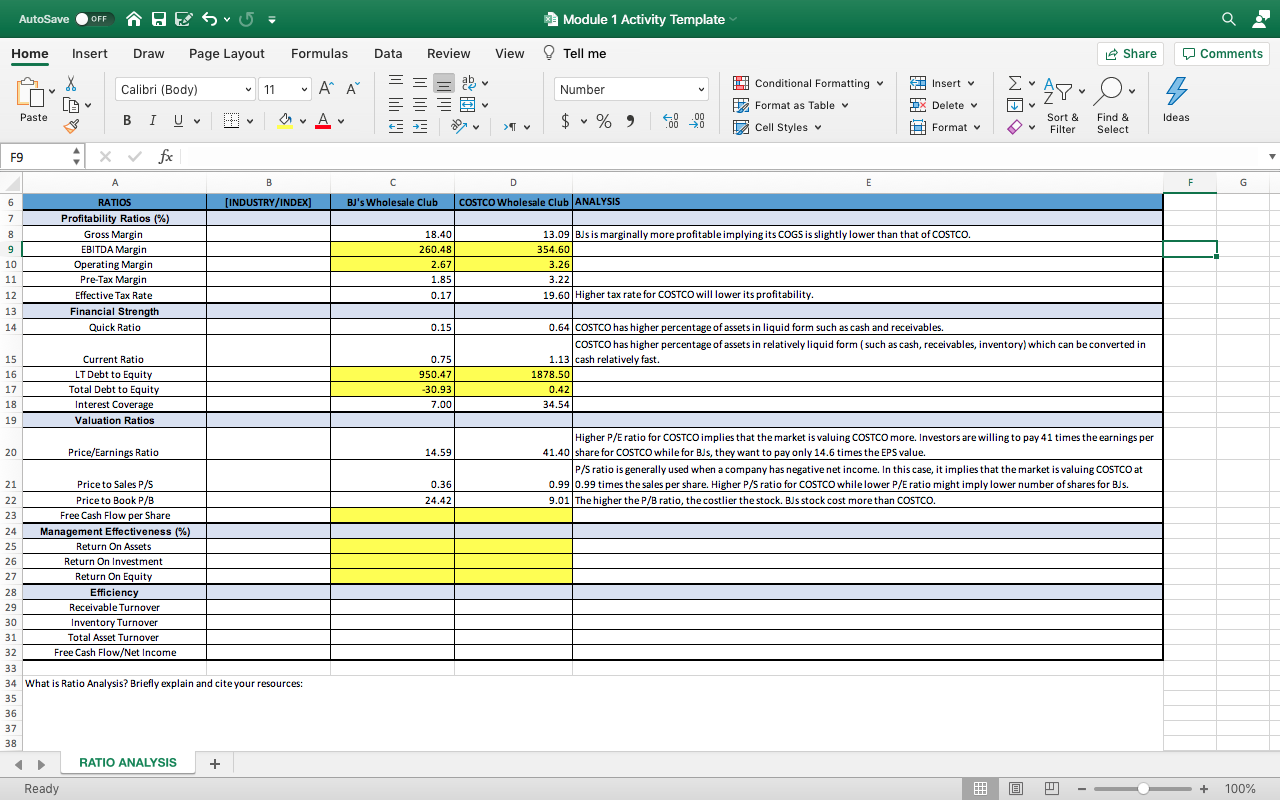
AutoSave OFF HES Module 1 Activity Template Home Insert Draw Page Layout Formulas Data Review View Tell me Share Comments X Calibri (Body) ab Insert v " 11 Number Conditional Formatting 2 Format as Table Cell Styles Ayu Ou s DX Delete v Paste B I U Av 19 $ %) Ideas .000 A Format v Sort & Filter Find & Select F9 fox A B D E F G 6 (INDUSTRY/INDEX] BJ's Wholesale Club COSTCO Wholesale Club ANALYSIS 7 8 9 10 11 12 RATIOS Profitability Ratios (%) Gross Margin EBITDA Margin Operating Margin Pre-Tax Margin Effective Tax Rate Tax Rate Financial Strength Quick Ratio 18.40 260.48 2.67 1.85 0.17 13.09 BJs is marginally more profitable implying its COGS is slightly lower than that of COSTCO. 354.60 3.26 3.22 19.60 Higher tax rate for COSTCO will lower its profitability. 13 - 14 19 0.15 15 16 17 18 19 Current Ratio LT Debt to Equity Total Debt to Equity Interest Coverage Valuation Ratios 0.75 950.47 -30.93 7.00 0.64 COSTCO has higher percentage of assets in liquid form such as cash and receivables. COSTCO has higher percentage of assets in relatively liquid form (such as cash, receivables, inventory) which can be converted in 1.13 cash relatively fast. 1878.50 0.42 34.54 20 Price/Earnings Ratio 14.59 Higher P/E ratio for COSTCO implies that the market is valuing COSTCO more. Investors are willing to pay 41 times the earnings per 41.40 share for COSTCO while for BJs, they want to pay only 14.6 times the EPS value. P/S ratio is generally used when a company has negative net income. In this case, it implies that the market is valuing COSTCO at 0.99 0.99 times the sales per share. Higher P/S ratio for COSTCO while lower P/E ratio might imply lower number of shares for Bus. 9.01 The higher the P/B ratio, the costlier the stock. BJs stock cost more than COSTCO. 0.36 24.42 21 Price to Sales P/S 22 Price to Book P/B 23 23 Free Cash Flow per Share 24 Management Effectiveness (%) 25 Return On Assets 26 Return On Investment 27 Return On Equity 28 Efficiency 29 Receivable Turnover 30 Inventory Turnover 31 Total Asset Turnover 32 Free Cash Flow/Net Income 33 34 What is Ratio Analysis? Briefly explain and cite your resources: 35 36 37 38 RATIO ANALYSIS + Ready W + 100% AutoSave OFF HES Module 1 Activity Template Home Insert Draw Page Layout Formulas Data Review View Tell me Share Comments X Calibri (Body) ab Insert v " 11 Number Conditional Formatting 2 Format as Table Cell Styles Ayu Ou s DX Delete v Paste B I U Av 19 $ %) Ideas .000 A Format v Sort & Filter Find & Select F9 fox A B D E F G 6 (INDUSTRY/INDEX] BJ's Wholesale Club COSTCO Wholesale Club ANALYSIS 7 8 9 10 11 12 RATIOS Profitability Ratios (%) Gross Margin EBITDA Margin Operating Margin Pre-Tax Margin Effective Tax Rate Tax Rate Financial Strength Quick Ratio 18.40 260.48 2.67 1.85 0.17 13.09 BJs is marginally more profitable implying its COGS is slightly lower than that of COSTCO. 354.60 3.26 3.22 19.60 Higher tax rate for COSTCO will lower its profitability. 13 - 14 19 0.15 15 16 17 18 19 Current Ratio LT Debt to Equity Total Debt to Equity Interest Coverage Valuation Ratios 0.75 950.47 -30.93 7.00 0.64 COSTCO has higher percentage of assets in liquid form such as cash and receivables. COSTCO has higher percentage of assets in relatively liquid form (such as cash, receivables, inventory) which can be converted in 1.13 cash relatively fast. 1878.50 0.42 34.54 20 Price/Earnings Ratio 14.59 Higher P/E ratio for COSTCO implies that the market is valuing COSTCO more. Investors are willing to pay 41 times the earnings per 41.40 share for COSTCO while for BJs, they want to pay only 14.6 times the EPS value. P/S ratio is generally used when a company has negative net income. In this case, it implies that the market is valuing COSTCO at 0.99 0.99 times the sales per share. Higher P/S ratio for COSTCO while lower P/E ratio might imply lower number of shares for Bus. 9.01 The higher the P/B ratio, the costlier the stock. BJs stock cost more than COSTCO. 0.36 24.42 21 Price to Sales P/S 22 Price to Book P/B 23 23 Free Cash Flow per Share 24 Management Effectiveness (%) 25 Return On Assets 26 Return On Investment 27 Return On Equity 28 Efficiency 29 Receivable Turnover 30 Inventory Turnover 31 Total Asset Turnover 32 Free Cash Flow/Net Income 33 34 What is Ratio Analysis? Briefly explain and cite your resources: 35 36 37 38 RATIO ANALYSIS + Ready W + 100%