Answered step by step
Verified Expert Solution
Question
1 Approved Answer
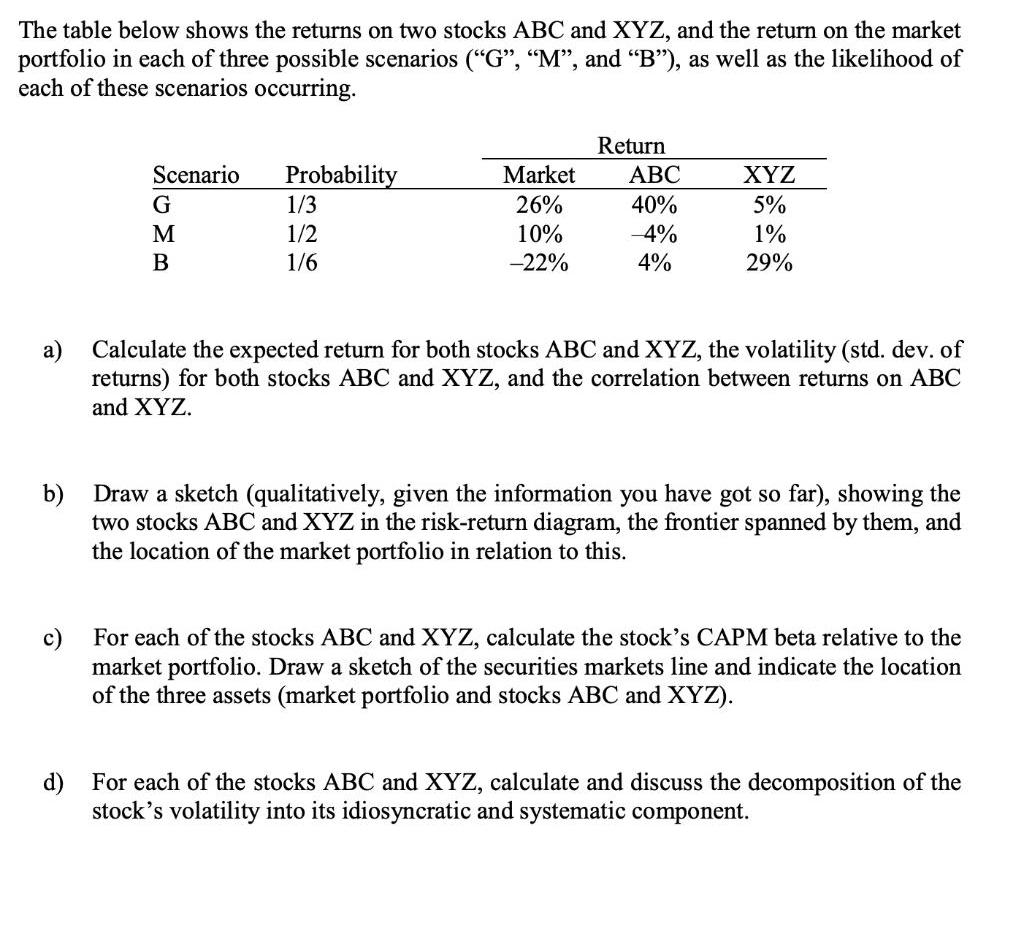
The table below shows the returns on two stocks ABC and XYZ, and the return on the market portfolio in each of three possible

The table below shows the returns on two stocks ABC and XYZ, and the return on the market portfolio in each of three possible scenarios ("G", "M", and "B"), as well as the likelihood of each of these scenarios occurring. Scenario G M B Probability 1/3 1/2 1/6 Market 26% 10% -22% Return ABC 40% -4% 4% XYZ 5% 1% 29% a) Calculate the expected return for both stocks ABC and XYZ, the volatility (std. dev. of returns) for both stocks ABC and XYZ, and the correlation between returns on ABC and XYZ. b) Draw a sketch (qualitatively, given the information you have got so far), showing the two stocks ABC and XYZ in the risk-return diagram, the frontier spanned by them, and the location of the market portfolio in relation to this. c) For each of the stocks ABC and XYZ, calculate the stock's CAPM beta relative to the market portfolio. Draw a sketch of the securities markets line and indicate the location of the three assets (market portfolio and stocks ABC and XYZ). d) For each of the stocks ABC and XYZ, calculate and discuss the decomposition of the stock's volatility into its idiosyncratic and systematic component.
Step by Step Solution
★★★★★
3.42 Rating (149 Votes )
There are 3 Steps involved in it
Step: 1

Get Instant Access to Expert-Tailored Solutions
See step-by-step solutions with expert insights and AI powered tools for academic success
Step: 2

Step: 3

Ace Your Homework with AI
Get the answers you need in no time with our AI-driven, step-by-step assistance
Get Started


