

Answered step by step
Verified Expert Solution
Question
1 Approved Answer
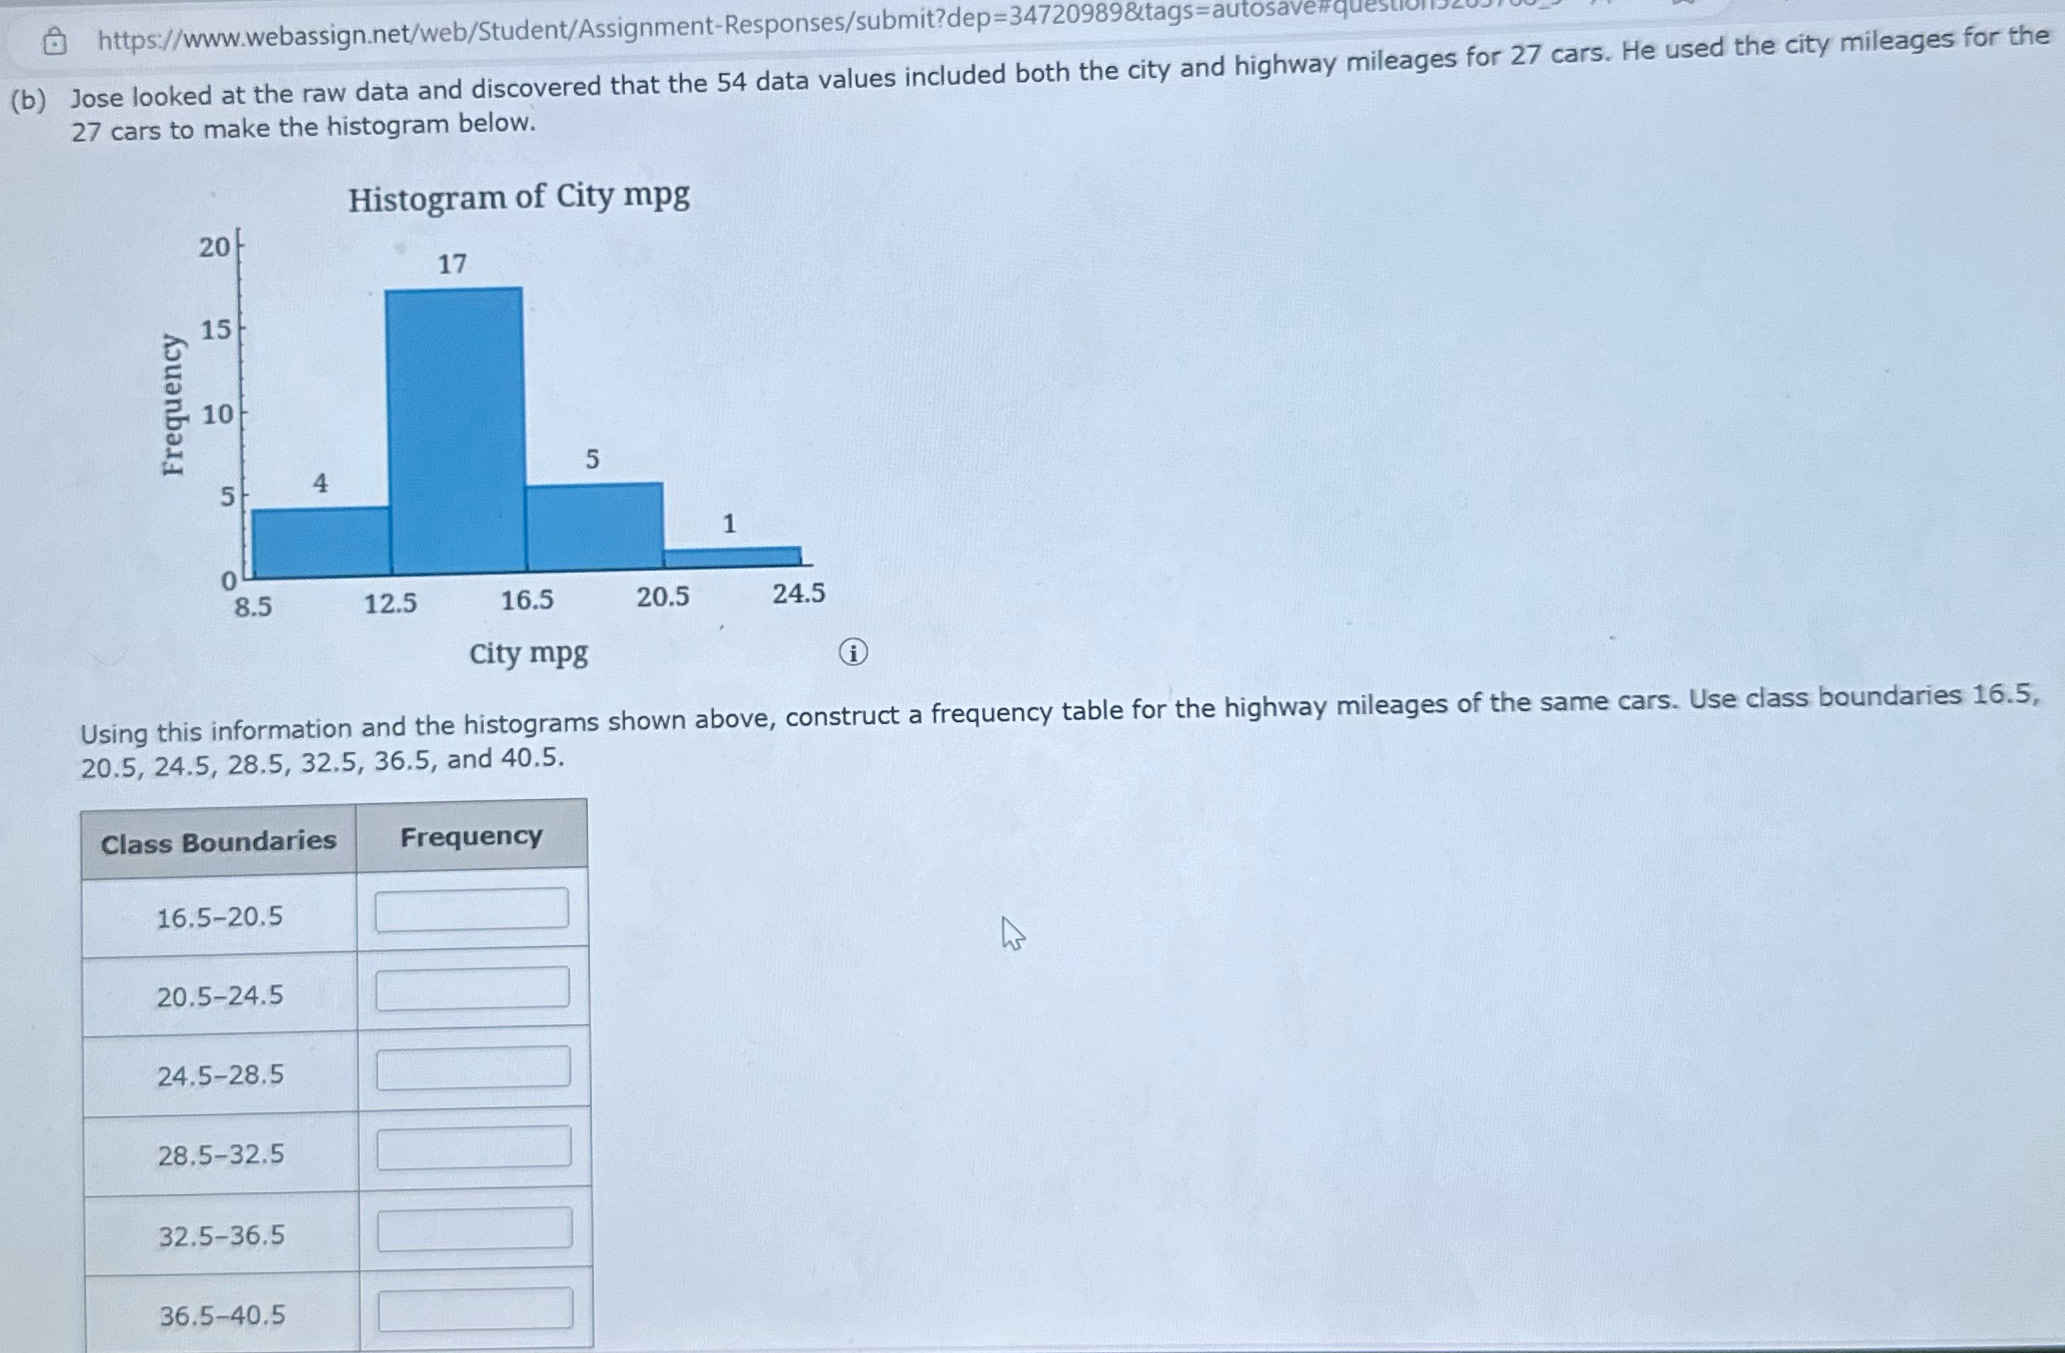
https://www.webassign.net/web/Student/Assignment-Responses/submit?dep=34720989&tags=autosave#qu ( b ) Jose looked at the raw data and discovered that the 54 data values included both the city and highway mileages for
Step by Step Solution
There are 3 Steps involved in it
Step: 1

Get Instant Access to Expert-Tailored Solutions
See step-by-step solutions with expert insights and AI powered tools for academic success
Step: 2

Step: 3
Ace Your Homework with AI
Get the answers you need in no time with our AI-driven, step-by-step assistance
Get Started
Linear Algebra
Authors: Jim Hefferon
1st Edition
978-0982406212, 0982406215