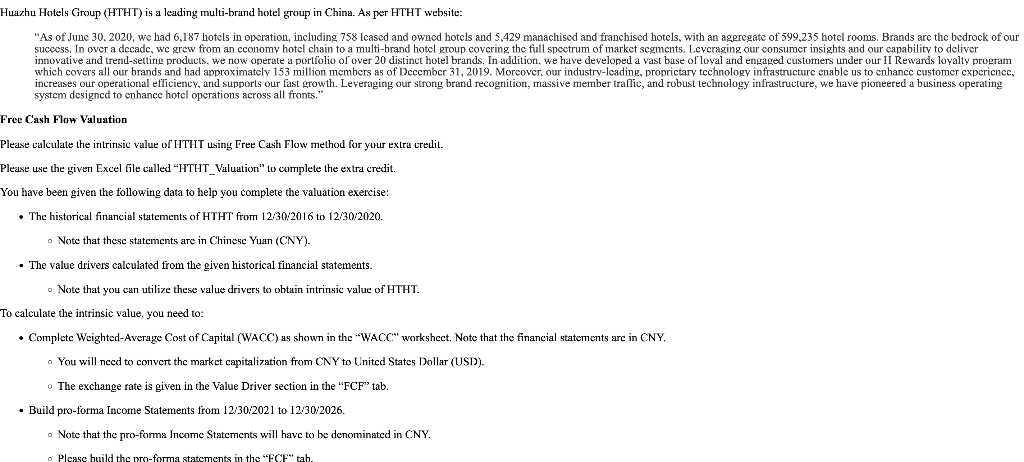


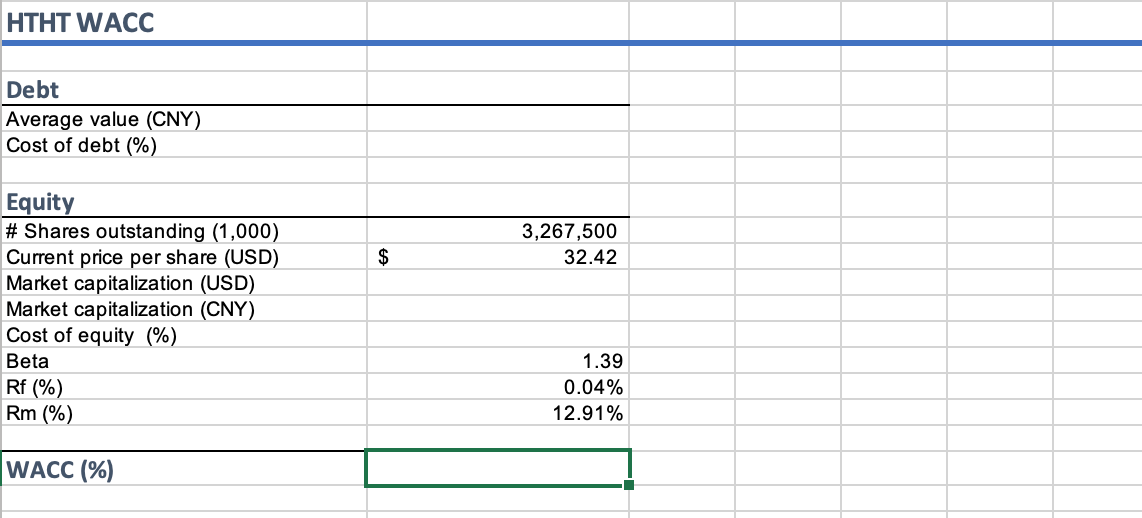
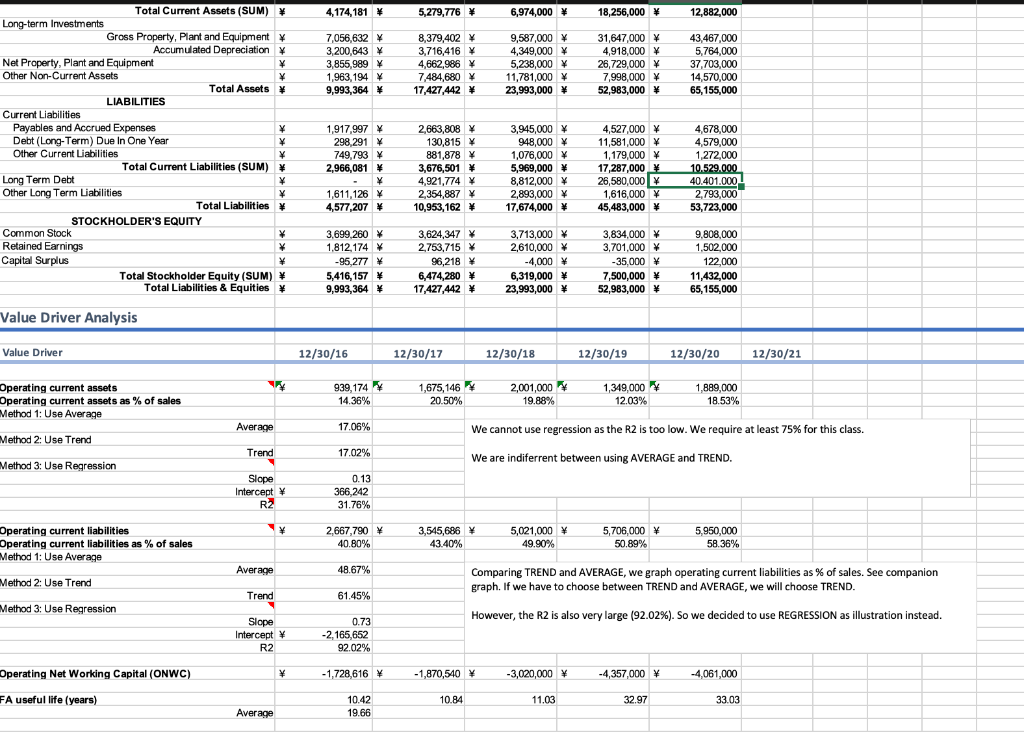
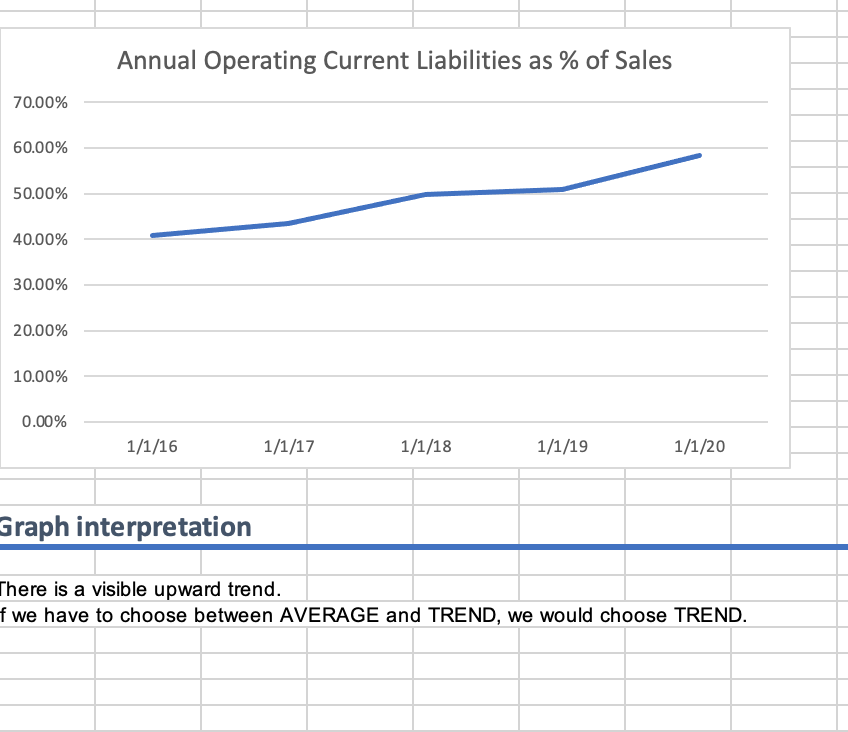
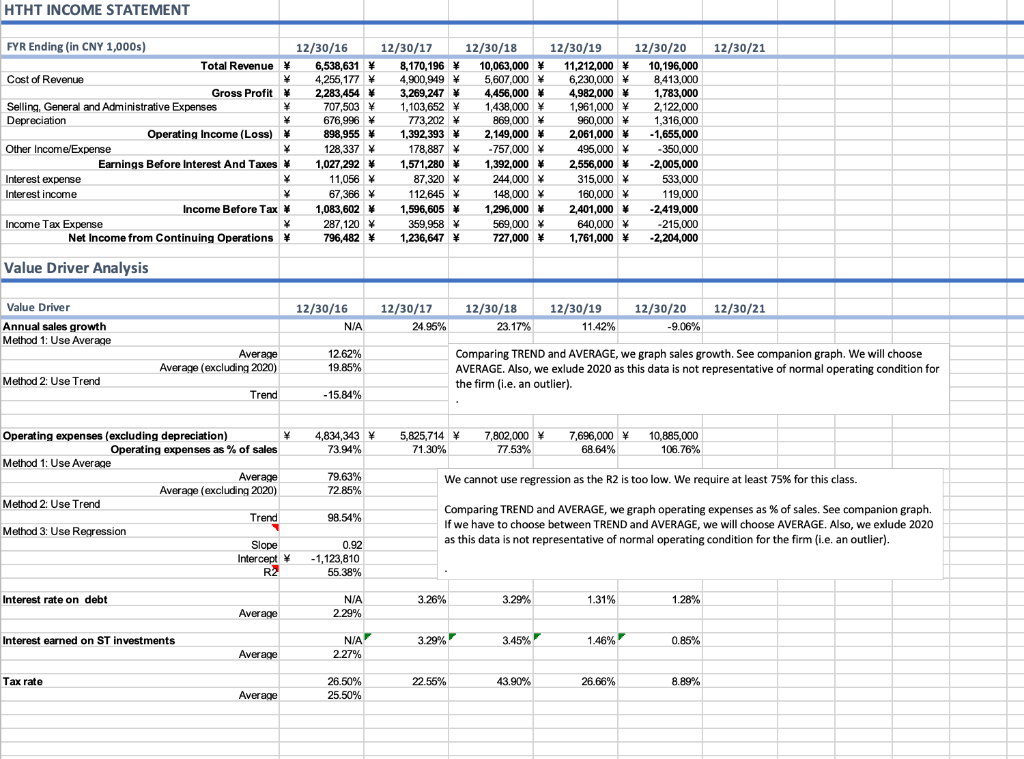
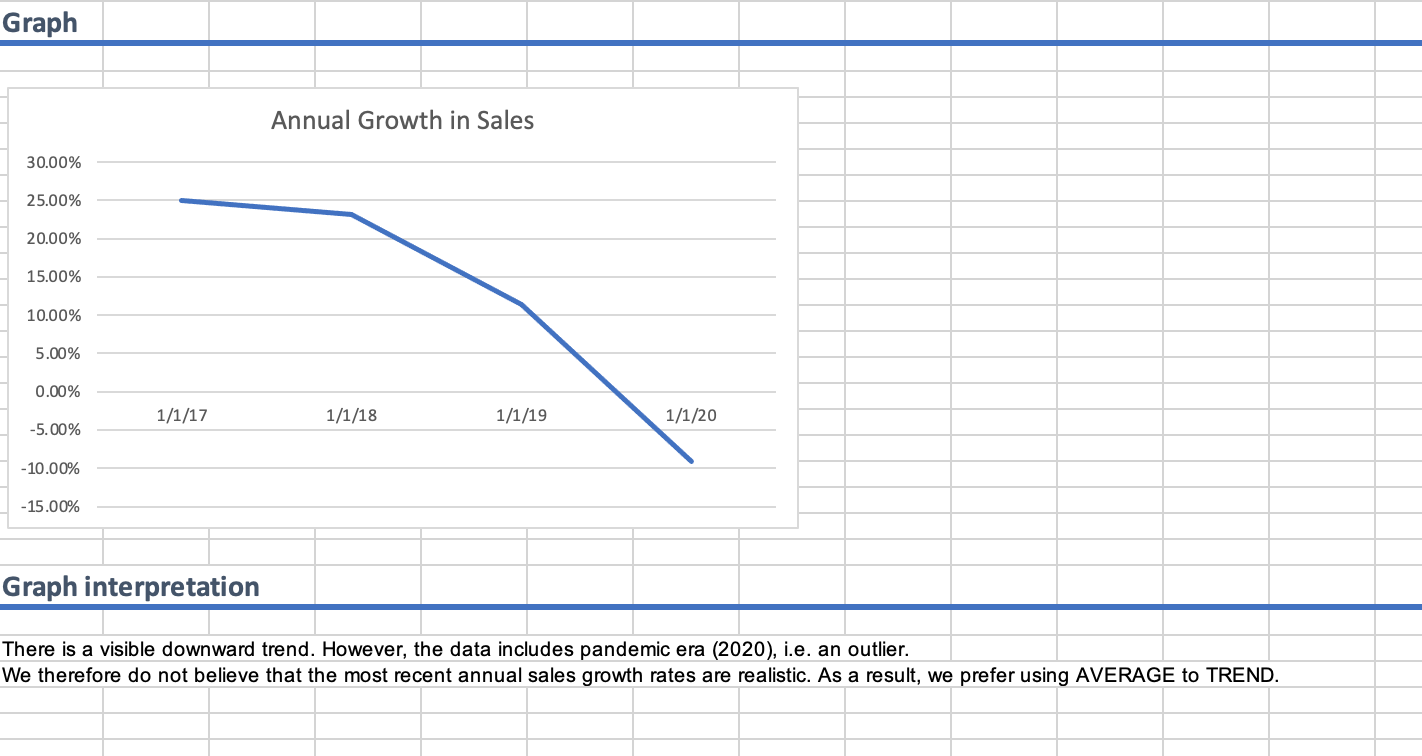
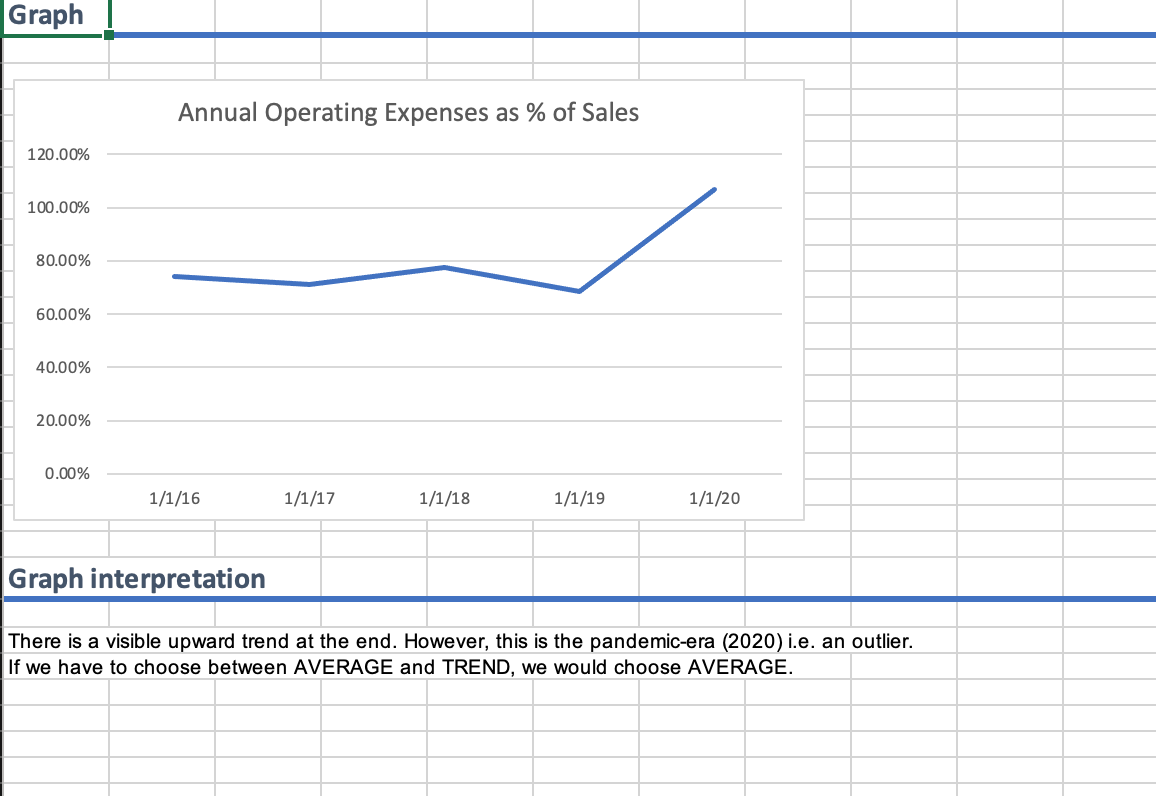
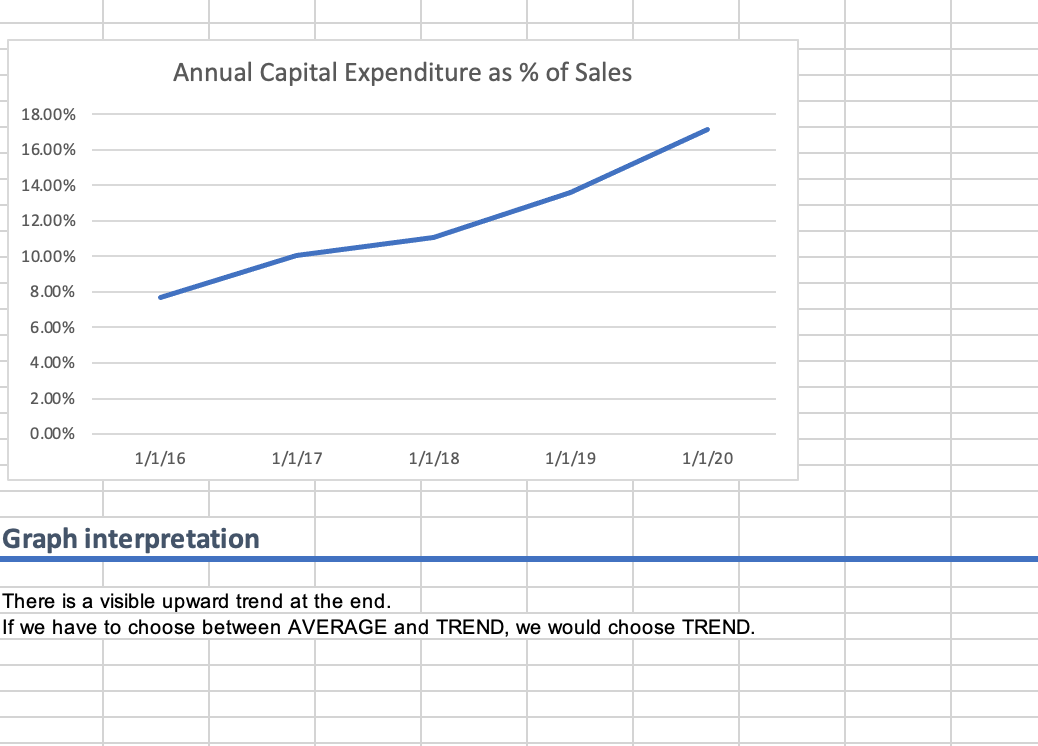
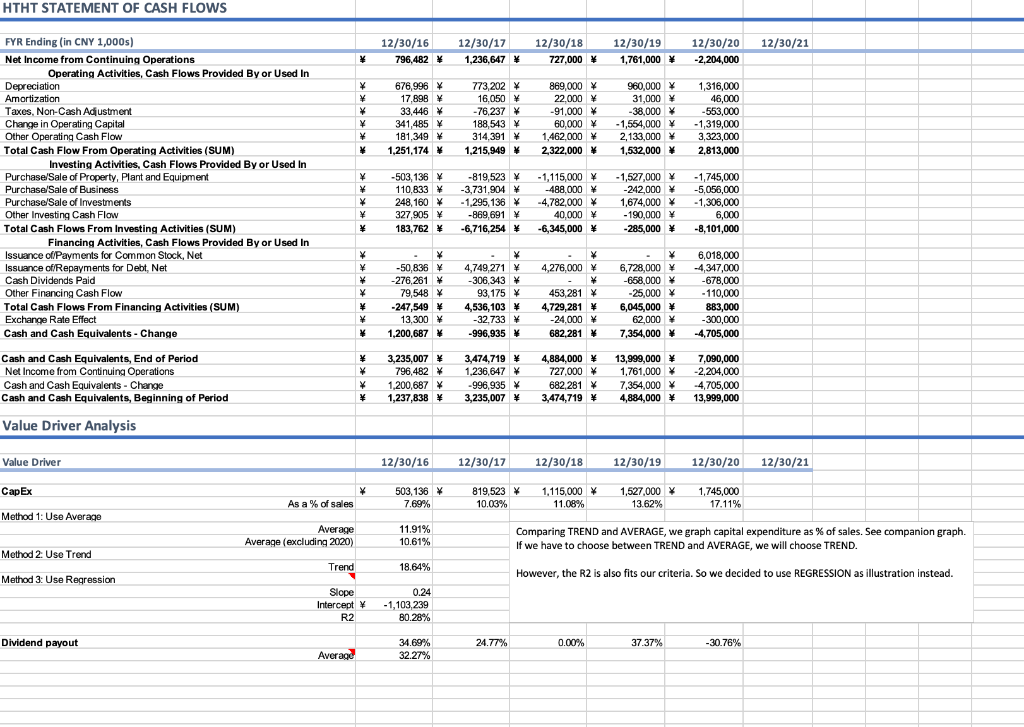
Huazhu Hotels Group (HTHT) is a leading multi-brand hotel group in China. As per HTHT website: "As of June 30.2020, we had 6,187 hotels in operation, including 758 leased and owned hotels and 5,429 manachised and franchised hotels, with an aggregate of 599,235 hotel rooms. Brands are the bedrock of our success. In over a decade, wc grew from an cconomy hotel chain to a multi-brand hotel group covering the full spectrum of market segments. Lcvcraging our consumer insights and our capability to deliver innovative and trend-setting products, we now operate a portfolio of over 20 distinct hotel brands. In addition, we have developed a vast base of loyal and engaged customers under our II Rewards loyalty program which covers all our brands and had approximately 153 million members as of December 31, 2019. Moreover, our industry-leading, proprictary technology infrastructure enable us to enhance customer experience, increases our operational efficiency, and supports our fast growth. Leveraging our strong brand recognition, massive member traffic, and robust technology infrastructure, we have pioneered a business operating system designed to enhance hotel operations across all fronts." Free Cash Flow Valuation Please calculate the intrinsic value of HTHT using Free Cash Flow method for your extra credit. Please use the given Excel file called "HTHT_Valuation" to complete the extra credit. You have been given the following data to help you complete the valuation exercise: The historical financial statements of HTHT from 12/30/2016 to 12/30/2020. . Note that these statements are in Chinese Yuan (CNY). The value drivers calculated from the given historical financial statements. Note that you can utilize these value drivers to obtain intrinsic value of HTHT. To calculate the intrinsic value, you need to: Complete Weighted Average Cost of Capital (WACC) as shown in the "WACC" worksheet. Note that the financial statements are in CNY, You will need to convert the market capitalization from CNY to United States Dollar (USD). The exchange rate is given in the Value Driver section in the "FCF" tab. Build pro-forma Income Statements from 12/30/2021 to 12/30/2026. Note that the pro-forma Income Statements will have to be denominated in CNY, Please build the pro-forma statements in the FCF" tab Calculate the fair price per share (intrinsic value) given the pro-forma Income Statements. o Note that the final intrinsic value should be in USD. o Please calculate the intrinsic value in the FCF tab. Please give an investment recommendation given the market price shown in WACC tab. o Would you recommend a BUY or a SELL investment recommendation? o Please give the investment recommendation in the FCF tab. Earnings Before Taxes Income Tax Expense Net Income HTHT Valuation 12/30/21 12/30/22 12/30/23 12/30/24 12/30/25 12/30/26 FYR Ending (in CNY 1,000s) Net Income Depreciation Capital Expenditures ONWC Change in ONWC Free Cash Flows Terminal Value Cash flows to be discounted (in CNY) PV of FCFs (in CNY) Equity Value (in CNY) Fair price per share (in CNY) Fair price per share (in USD) Recommendation HTHT WACC Debt Average value (CNY) Cost of debt (%) 3,267,500 32.42 $ Equity # Shares outstanding (1,000) Current price per share (USD) Market capitalization (USD) Market capitalization (CNY) Cost of equity (%) Beta Rf (%) Rm (%) 1.39 0.04% 12.91% WACC (%) 4,174,181 5,279,776 6,974,000 18,256,000 $ 12,882,000 7,056,632 3.200.643 3,855,989 1,963, 194 9,993,364 8,379,402 3,716,416 4,662,986 7,484,680 * 17,427,442 9,587,000 4,349,000 5,238,000 11,781,000 23,993,000 31,647,000 4,918,000 26,729,000 7,998,000 52,983,000 43,467,000 5,764,000 37,703,000 14,570,000 65,155,000 Total Current Assets (SUM) W Long-term Investments Gross Property, Plant and Equipment Accumulated Depreciation Net Property, Plant and Equipment Other Non-Current Assets Total Assets LIABILITIES Current Liabilities Payables and Accrued Expenses Debt (Long-Term) Due In One Year ) Other Current Liabilities Total Current Liabilities (SUM) * Long Term Debt Other Long Term Liabilities * Total Liabilities STOCKHOLDER'S EQUITY Common Stock Retained Earnings Capital Surplus Total Stockholder Equity (SUM) W Total Liabilities & Equities 1,917,997 298,291 749,793 2,966,081 2,663,808 130,815 881,878 3,676,501 4,921,774 2,354,887 10,953,162 3,945,000 948.000 1,076,000 5,969,000 8,812,000 2,893,000 17,674,000 4,527,000 11,581,000 1,179,000 17,287,000 26,580,000 1,616,000 45,483,000 4,678,000 4,579,000 1,272,000 10.529.000 40.401.000 2,793,000 53,723,000 1,611,126 4,577,207 3,699.260 1,812,174 * -95,277 * 5,416,157 9,993,364 3,624,347 2,753,715 * 96,218 6,474,280 * 17,427,442 3,713,000 2,610,000 -4,000 W 6,319,000 23,993,000 $ 3,834,000 * 3,701,000 -35,000 7,500,000 52,983,000 9,808,000 1,502.000 122,000 11,432,000 65,155,000 Value Driver Analysis Value Driver 12/30/16 12/30/17 12/30/18 12/30/19 12/30/20 12/30/21 939, 174 1,675,146 2,001,000 Operating current assets Operating current assets as % of sales Method 1: Use Average 1,349,000 12.03% 14.36% 20.50% 1,889,000 18.53% 19.88% Average 17.06% We cannot use regression as the R2 is too low. We require at least 75% for this class. Method 2: Use Trend Trend 17.02% We are indiferrent between using AVERAGE and TREND. Method 3: Use Regression Slope Intercept R2 0.13 366.242 31.76% Operating current liabilities Operating current liabilities as % of sales Method 1: Use Average 2,667,790 40.80% 3,545,686 43.40% 5,021,000 49.90% 5,706,000 50.89% 5,950,000 58.36% Average 48.67% Method 2: Use Trend Comparing TREND and AVERAGE, we graph operating current liabilities as % of sales. See companion graph. If we have to choose between TREND and AVERAGE, we will choose TREND. Trend 61.45% Method 3: Use Regression However, the R2 is also very large (92.02%). So we decided to use REGRESSION as illustration instead. ). Slope Intercept R2 0.73 -2,165,652 92.02% Operating Net Working Capital (ONWC) \ W -1,728,616 -1,870,540 -3,020,000 -4,357,000 $ -4,061,000 FA useful life (years) 10.84 11.03 32.97 33.03 10.42 19.66 Average Annual Operating Current Liabilities as % of Sales 70.00% 60.00% 50.00% 40.00% 30.00% 20.00% 10.00% 0.00% 1/1/16 1/1/17 1/1/18 1/1/19 1/1/20 Graph interpretation There is a visible upward trend. f we have to choose between AVERAGE and TREND, we would choose TREND. HTHT INCOME STATEMENT 12/30/21 FYR Ending (in CNY 1,000s) 12/30/16 12/30/17 12/30/18 12/30/19 Total Revenue * 6,538,631 * 8,170,196 * 10,063,000 11,212,000 Cost of Revenue 4,255,177 * 4,900,949 * 5,607,000 6,230,000 Gross Profit 2,283,454 3,269,247 * 4,456,000 4,982,000 Selling, General and Administrative Expenses V 707,503 1,103,652 1,438,000 1,961,000 Depreciation 676,996 773,202 * 869,000 960,000 Operating Income (Loss) 898,955 * 1,392,393 * 2,149,000 2,061,000 Other Income/Expense 128,337 178,887 -757.000 x 495,000 Earnings Before Interest And Taxes * 1,027,292 * 1,571,280 1,392,000 2,556,000 Interest expense 11,056 * 87,320 * 244,000 315,000 Interest income 67,366 * 112,645 * 148,000 160,000 Income Before Tax * 1,083,602 1,596,605 1,296,000 2,401,000 Income Tax Expense 287,120 359,958 * 569,000 640,000 * Net Income from Continuing Operations 796,482 1,236,647 727,000 $ 1,761,000 12/30/20 10,196,000 8,413,000 1,783,000 2,122,000 1,316,000 -1.655,000 -350,000 -2,005,000 533,000 119,000 -2,419,000 -215,000 -2,204,000 Value Driver Analysis Value Driver 12/30/16 N/A 12/30/17 24.95% Annual sales growth Method 1: Use Average Average Average (excluding 2020) 12/30/18 12/30/19 12/30/20 12/30/21 23.17% 11.42% -9.06% Comparing TREND and AVERAGE, we graph sales growth. See companion graph. We will choose AVERAGE. Also, we exlude 2020 as this data is not representative of normal operating condition for the firm (.e. an outlier). 12.62% 19.85% Method 2: Use Trend Trend - 15.84% 4,834,343 73.94% 5,825,714 71.30% 7,802,000 77.53% 7,696,000 68.64% 10,885,000 106.76% 79.63% 72.85% We cannot use regression as the R2 is too low. We require at least 75% for this class. Operating expenses (excluding depreciation) Operating expenses as % of sales Method 1: Use Average : Average Average (excluding 2020) Method 2: Use Trend Trend Method 3: Use Regression Slope Intercept R2 98.54% Comparing TREND and AVERAGE, we graph operating expenses as % of sales. See companion graph. If we have to choose between TREND and AVERAGE, we will choose AVERAGE. Also, we exlude 2020 as this data is not representative of normal operating condition for the firm (i.e. an outlier). 0.92 -1,123,810 55,38% Interest rate on debt 3.26% 3.29% 1.31% 1.28% N/A 2.29% Average Interest earned on ST investments 3.29% 3.45% 1.46% N/A 2.27% 0.85% Average Tax rate 22.55% 43.90% 26.66% 8.89% Average 26.50% 25.50% Graph Annual Growth in Sales 30.00% 25.00% 20.00% 15.00% 10.00% 5.00% 0.00% 1/1/17 1/1/18 1/1/19 1/1/20 -5.00% - 10.00% -15.00% Graph interpretation There is a visible downward trend. However, the data includes pandemic era (2020), i.e. an outlier. We therefore do not believe that the most recent annual sales growth rates are realistic. As a result, we prefer using AVERAGE to TREND. Graph Annual Operating Expenses as % of Sales 120.00% 100.00% 80.00% 60.00% 40.00% 20.00% 0.00% 1/1/16 1/1/17 1/1/18 1/1/19 1/1/20 Graph interpretation There is a visible upward trend at the end. However, this is the pandemic-era (2020) i.e. an outlier. If we have to choose between AVERAGE and TREND, we would choose AVERAGE. Annual Capital Expenditure as % of Sales 18.00% 16.00% 14.00% 12.00% 10.00% 8.00% 6.00% 4.00% 2.00% 0.00% 1/1/16 1/1/17 1/1/18 1/1/19 1/1/20 Graph interpretation There is a visible upward trend at the end. If we have to choose between AVERAGE and TREND, we would choose TREND. HTHT STATEMENT OF CASH FLOWS 12/30/21 12/30/16 796,482 12/30/17 1,236,647 12/30/18 727,000 $ 12/30/19 1,761,000 12/30/20 -2,204,000 * 676,996 * 17,898 33,446 341,485 181,349 1,251,174 * 773,202 16.050 -76,237 188,543 314,391 1,215,949 * 869,000 22.000 -91,000 60.000 1,462,000 * 2,322,000 960,000 31,000 -38,000 - 1,554,000 2,133,000 1,532,000 1,316,000 46,000 -553,000 -1,319,000 3,323,000 2,813,000 # * # FYR Ending (in CNY 1,000s) Net Income from Continuing Operations Operating Activities, Cash Flows Provided By or Used In Depreciation Amortization Taxes, Non-Cash Adjustment Change in Operating Capital Other Operating Cash Flow Total Cash Flow From Operating Activities (SUM) Investing Activities, Cash Flows Provided By or Used In Purchase Sale of Property, Plant and Equipment Purchase/Sale of Business Purchase Sale of Investments Other Investing Cash Flow Total Cash Flows From Investing Activities (SUM) Financing Activities, Cash Flows Provided By or Used In Issuance of Payments for Common Stock, Net Issuance of/Repayments for Debt, Net Cash Dividends Paid Other Financing Cash Flow Total Cash Flows From Financing Activities (SUM) Exchange Rate Effect Cash and Cash Equivalents - Change Cash and Cash Equivalents, End of Period Net Income from Continuing Operations Cash and Cash Equivalents - Change Cash and Cash Equivalents, Beginning of Period -503,136 110,833 248, 160 327,905 183,762 -819,523 -3,731,904 - 1,295, 136 -869,691 -6,716,254 - 1,115,000 -488,000 -4,782,000 40.000 -6,345,000 -1,527,000 -242,000 1,674,000 - 190,000 -285,000 - 1,745,000 -5,056,000 -1,306,000 6,000 -8,101,000 * * 4,276,000 # -50,836 -276,261 79,548 -247,549 13,300 1,200,687 * 4,749,271 -306,343 * 93,175 4,536, 103 -32,733 -996,935 453,281 4,729,281 -24.000 682,281 6,728,000 -658,000 -25,000 6,045,000 62,000 * 7,354,000 6,018,000 -4,347,000 -678,000 -110,000 883,000 -300,000 -4,705,000 * * * 3,235,007 * 796,482 1,200,687 1,237,838 3,474,719 * 1,236,647 -996,935 * 3,235,007 4,884,000 $ 727,000 682,281 3,474,719 13,999,000 1,761,000 7,354,000 4,884,000 7,090,000 -2,204,000 -4,705,000 13,999,000 Value Driver Analysis Value Driver 12/30/16 12/30/17 12/30/18 12/30/19 12/30/20 12/30/21 Cap Ex * As a % of sales 503, 136 7.69% 819,523 * 10.03% 1,115,000 11.08% 1,527,000 * 13.62% 1,745,000 17.11% Method 1: Use Averago Average Average (excluding 2020) 11.91% 10.61% Comparing TREND and AVERAGE, we graph capital expenditure as % of sales. See companion graph. If we have to choose between TREND and AVERAGE, we will choose TREND. Method 2: Use Trend Trend 18.64% However, the R2 is also fits our criteria. So we decided to use REGRESSION as illustration instead. Method 3: Use Regression Slope Intercept R2 0.24 -1,103,239 80.28% Dividend payout 24.77% 0.00% 37.37% -30.76% Average 34.69% 32.27% Huazhu Hotels Group (HTHT) is a leading multi-brand hotel group in China. As per HTHT website: "As of June 30.2020, we had 6,187 hotels in operation, including 758 leased and owned hotels and 5,429 manachised and franchised hotels, with an aggregate of 599,235 hotel rooms. Brands are the bedrock of our success. In over a decade, wc grew from an cconomy hotel chain to a multi-brand hotel group covering the full spectrum of market segments. Lcvcraging our consumer insights and our capability to deliver innovative and trend-setting products, we now operate a portfolio of over 20 distinct hotel brands. In addition, we have developed a vast base of loyal and engaged customers under our II Rewards loyalty program which covers all our brands and had approximately 153 million members as of December 31, 2019. Moreover, our industry-leading, proprictary technology infrastructure enable us to enhance customer experience, increases our operational efficiency, and supports our fast growth. Leveraging our strong brand recognition, massive member traffic, and robust technology infrastructure, we have pioneered a business operating system designed to enhance hotel operations across all fronts." Free Cash Flow Valuation Please calculate the intrinsic value of HTHT using Free Cash Flow method for your extra credit. Please use the given Excel file called "HTHT_Valuation" to complete the extra credit. You have been given the following data to help you complete the valuation exercise: The historical financial statements of HTHT from 12/30/2016 to 12/30/2020. . Note that these statements are in Chinese Yuan (CNY). The value drivers calculated from the given historical financial statements. Note that you can utilize these value drivers to obtain intrinsic value of HTHT. To calculate the intrinsic value, you need to: Complete Weighted Average Cost of Capital (WACC) as shown in the "WACC" worksheet. Note that the financial statements are in CNY, You will need to convert the market capitalization from CNY to United States Dollar (USD). The exchange rate is given in the Value Driver section in the "FCF" tab. Build pro-forma Income Statements from 12/30/2021 to 12/30/2026. Note that the pro-forma Income Statements will have to be denominated in CNY, Please build the pro-forma statements in the FCF" tab Calculate the fair price per share (intrinsic value) given the pro-forma Income Statements. o Note that the final intrinsic value should be in USD. o Please calculate the intrinsic value in the FCF tab. Please give an investment recommendation given the market price shown in WACC tab. o Would you recommend a BUY or a SELL investment recommendation? o Please give the investment recommendation in the FCF tab. Earnings Before Taxes Income Tax Expense Net Income HTHT Valuation 12/30/21 12/30/22 12/30/23 12/30/24 12/30/25 12/30/26 FYR Ending (in CNY 1,000s) Net Income Depreciation Capital Expenditures ONWC Change in ONWC Free Cash Flows Terminal Value Cash flows to be discounted (in CNY) PV of FCFs (in CNY) Equity Value (in CNY) Fair price per share (in CNY) Fair price per share (in USD) Recommendation HTHT WACC Debt Average value (CNY) Cost of debt (%) 3,267,500 32.42 $ Equity # Shares outstanding (1,000) Current price per share (USD) Market capitalization (USD) Market capitalization (CNY) Cost of equity (%) Beta Rf (%) Rm (%) 1.39 0.04% 12.91% WACC (%) 4,174,181 5,279,776 6,974,000 18,256,000 $ 12,882,000 7,056,632 3.200.643 3,855,989 1,963, 194 9,993,364 8,379,402 3,716,416 4,662,986 7,484,680 * 17,427,442 9,587,000 4,349,000 5,238,000 11,781,000 23,993,000 31,647,000 4,918,000 26,729,000 7,998,000 52,983,000 43,467,000 5,764,000 37,703,000 14,570,000 65,155,000 Total Current Assets (SUM) W Long-term Investments Gross Property, Plant and Equipment Accumulated Depreciation Net Property, Plant and Equipment Other Non-Current Assets Total Assets LIABILITIES Current Liabilities Payables and Accrued Expenses Debt (Long-Term) Due In One Year ) Other Current Liabilities Total Current Liabilities (SUM) * Long Term Debt Other Long Term Liabilities * Total Liabilities STOCKHOLDER'S EQUITY Common Stock Retained Earnings Capital Surplus Total Stockholder Equity (SUM) W Total Liabilities & Equities 1,917,997 298,291 749,793 2,966,081 2,663,808 130,815 881,878 3,676,501 4,921,774 2,354,887 10,953,162 3,945,000 948.000 1,076,000 5,969,000 8,812,000 2,893,000 17,674,000 4,527,000 11,581,000 1,179,000 17,287,000 26,580,000 1,616,000 45,483,000 4,678,000 4,579,000 1,272,000 10.529.000 40.401.000 2,793,000 53,723,000 1,611,126 4,577,207 3,699.260 1,812,174 * -95,277 * 5,416,157 9,993,364 3,624,347 2,753,715 * 96,218 6,474,280 * 17,427,442 3,713,000 2,610,000 -4,000 W 6,319,000 23,993,000 $ 3,834,000 * 3,701,000 -35,000 7,500,000 52,983,000 9,808,000 1,502.000 122,000 11,432,000 65,155,000 Value Driver Analysis Value Driver 12/30/16 12/30/17 12/30/18 12/30/19 12/30/20 12/30/21 939, 174 1,675,146 2,001,000 Operating current assets Operating current assets as % of sales Method 1: Use Average 1,349,000 12.03% 14.36% 20.50% 1,889,000 18.53% 19.88% Average 17.06% We cannot use regression as the R2 is too low. We require at least 75% for this class. Method 2: Use Trend Trend 17.02% We are indiferrent between using AVERAGE and TREND. Method 3: Use Regression Slope Intercept R2 0.13 366.242 31.76% Operating current liabilities Operating current liabilities as % of sales Method 1: Use Average 2,667,790 40.80% 3,545,686 43.40% 5,021,000 49.90% 5,706,000 50.89% 5,950,000 58.36% Average 48.67% Method 2: Use Trend Comparing TREND and AVERAGE, we graph operating current liabilities as % of sales. See companion graph. If we have to choose between TREND and AVERAGE, we will choose TREND. Trend 61.45% Method 3: Use Regression However, the R2 is also very large (92.02%). So we decided to use REGRESSION as illustration instead. ). Slope Intercept R2 0.73 -2,165,652 92.02% Operating Net Working Capital (ONWC) \ W -1,728,616 -1,870,540 -3,020,000 -4,357,000 $ -4,061,000 FA useful life (years) 10.84 11.03 32.97 33.03 10.42 19.66 Average Annual Operating Current Liabilities as % of Sales 70.00% 60.00% 50.00% 40.00% 30.00% 20.00% 10.00% 0.00% 1/1/16 1/1/17 1/1/18 1/1/19 1/1/20 Graph interpretation There is a visible upward trend. f we have to choose between AVERAGE and TREND, we would choose TREND. HTHT INCOME STATEMENT 12/30/21 FYR Ending (in CNY 1,000s) 12/30/16 12/30/17 12/30/18 12/30/19 Total Revenue * 6,538,631 * 8,170,196 * 10,063,000 11,212,000 Cost of Revenue 4,255,177 * 4,900,949 * 5,607,000 6,230,000 Gross Profit 2,283,454 3,269,247 * 4,456,000 4,982,000 Selling, General and Administrative Expenses V 707,503 1,103,652 1,438,000 1,961,000 Depreciation 676,996 773,202 * 869,000 960,000 Operating Income (Loss) 898,955 * 1,392,393 * 2,149,000 2,061,000 Other Income/Expense 128,337 178,887 -757.000 x 495,000 Earnings Before Interest And Taxes * 1,027,292 * 1,571,280 1,392,000 2,556,000 Interest expense 11,056 * 87,320 * 244,000 315,000 Interest income 67,366 * 112,645 * 148,000 160,000 Income Before Tax * 1,083,602 1,596,605 1,296,000 2,401,000 Income Tax Expense 287,120 359,958 * 569,000 640,000 * Net Income from Continuing Operations 796,482 1,236,647 727,000 $ 1,761,000 12/30/20 10,196,000 8,413,000 1,783,000 2,122,000 1,316,000 -1.655,000 -350,000 -2,005,000 533,000 119,000 -2,419,000 -215,000 -2,204,000 Value Driver Analysis Value Driver 12/30/16 N/A 12/30/17 24.95% Annual sales growth Method 1: Use Average Average Average (excluding 2020) 12/30/18 12/30/19 12/30/20 12/30/21 23.17% 11.42% -9.06% Comparing TREND and AVERAGE, we graph sales growth. See companion graph. We will choose AVERAGE. Also, we exlude 2020 as this data is not representative of normal operating condition for the firm (.e. an outlier). 12.62% 19.85% Method 2: Use Trend Trend - 15.84% 4,834,343 73.94% 5,825,714 71.30% 7,802,000 77.53% 7,696,000 68.64% 10,885,000 106.76% 79.63% 72.85% We cannot use regression as the R2 is too low. We require at least 75% for this class. Operating expenses (excluding depreciation) Operating expenses as % of sales Method 1: Use Average : Average Average (excluding 2020) Method 2: Use Trend Trend Method 3: Use Regression Slope Intercept R2 98.54% Comparing TREND and AVERAGE, we graph operating expenses as % of sales. See companion graph. If we have to choose between TREND and AVERAGE, we will choose AVERAGE. Also, we exlude 2020 as this data is not representative of normal operating condition for the firm (i.e. an outlier). 0.92 -1,123,810 55,38% Interest rate on debt 3.26% 3.29% 1.31% 1.28% N/A 2.29% Average Interest earned on ST investments 3.29% 3.45% 1.46% N/A 2.27% 0.85% Average Tax rate 22.55% 43.90% 26.66% 8.89% Average 26.50% 25.50% Graph Annual Growth in Sales 30.00% 25.00% 20.00% 15.00% 10.00% 5.00% 0.00% 1/1/17 1/1/18 1/1/19 1/1/20 -5.00% - 10.00% -15.00% Graph interpretation There is a visible downward trend. However, the data includes pandemic era (2020), i.e. an outlier. We therefore do not believe that the most recent annual sales growth rates are realistic. As a result, we prefer using AVERAGE to TREND. Graph Annual Operating Expenses as % of Sales 120.00% 100.00% 80.00% 60.00% 40.00% 20.00% 0.00% 1/1/16 1/1/17 1/1/18 1/1/19 1/1/20 Graph interpretation There is a visible upward trend at the end. However, this is the pandemic-era (2020) i.e. an outlier. If we have to choose between AVERAGE and TREND, we would choose AVERAGE. Annual Capital Expenditure as % of Sales 18.00% 16.00% 14.00% 12.00% 10.00% 8.00% 6.00% 4.00% 2.00% 0.00% 1/1/16 1/1/17 1/1/18 1/1/19 1/1/20 Graph interpretation There is a visible upward trend at the end. If we have to choose between AVERAGE and TREND, we would choose TREND. HTHT STATEMENT OF CASH FLOWS 12/30/21 12/30/16 796,482 12/30/17 1,236,647 12/30/18 727,000 $ 12/30/19 1,761,000 12/30/20 -2,204,000 * 676,996 * 17,898 33,446 341,485 181,349 1,251,174 * 773,202 16.050 -76,237 188,543 314,391 1,215,949 * 869,000 22.000 -91,000 60.000 1,462,000 * 2,322,000 960,000 31,000 -38,000 - 1,554,000 2,133,000 1,532,000 1,316,000 46,000 -553,000 -1,319,000 3,323,000 2,813,000 # * # FYR Ending (in CNY 1,000s) Net Income from Continuing Operations Operating Activities, Cash Flows Provided By or Used In Depreciation Amortization Taxes, Non-Cash Adjustment Change in Operating Capital Other Operating Cash Flow Total Cash Flow From Operating Activities (SUM) Investing Activities, Cash Flows Provided By or Used In Purchase Sale of Property, Plant and Equipment Purchase/Sale of Business Purchase Sale of Investments Other Investing Cash Flow Total Cash Flows From Investing Activities (SUM) Financing Activities, Cash Flows Provided By or Used In Issuance of Payments for Common Stock, Net Issuance of/Repayments for Debt, Net Cash Dividends Paid Other Financing Cash Flow Total Cash Flows From Financing Activities (SUM) Exchange Rate Effect Cash and Cash Equivalents - Change Cash and Cash Equivalents, End of Period Net Income from Continuing Operations Cash and Cash Equivalents - Change Cash and Cash Equivalents, Beginning of Period -503,136 110,833 248, 160 327,905 183,762 -819,523 -3,731,904 - 1,295, 136 -869,691 -6,716,254 - 1,115,000 -488,000 -4,782,000 40.000 -6,345,000 -1,527,000 -242,000 1,674,000 - 190,000 -285,000 - 1,745,000 -5,056,000 -1,306,000 6,000 -8,101,000 * * 4,276,000 # -50,836 -276,261 79,548 -247,549 13,300 1,200,687 * 4,749,271 -306,343 * 93,175 4,536, 103 -32,733 -996,935 453,281 4,729,281 -24.000 682,281 6,728,000 -658,000 -25,000 6,045,000 62,000 * 7,354,000 6,018,000 -4,347,000 -678,000 -110,000 883,000 -300,000 -4,705,000 * * * 3,235,007 * 796,482 1,200,687 1,237,838 3,474,719 * 1,236,647 -996,935 * 3,235,007 4,884,000 $ 727,000 682,281 3,474,719 13,999,000 1,761,000 7,354,000 4,884,000 7,090,000 -2,204,000 -4,705,000 13,999,000 Value Driver Analysis Value Driver 12/30/16 12/30/17 12/30/18 12/30/19 12/30/20 12/30/21 Cap Ex * As a % of sales 503, 136 7.69% 819,523 * 10.03% 1,115,000 11.08% 1,527,000 * 13.62% 1,745,000 17.11% Method 1: Use Averago Average Average (excluding 2020) 11.91% 10.61% Comparing TREND and AVERAGE, we graph capital expenditure as % of sales. See companion graph. If we have to choose between TREND and AVERAGE, we will choose TREND. Method 2: Use Trend Trend 18.64% However, the R2 is also fits our criteria. So we decided to use REGRESSION as illustration instead. Method 3: Use Regression Slope Intercept R2 0.24 -1,103,239 80.28% Dividend payout 24.77% 0.00% 37.37% -30.76% Average 34.69% 32.27%


