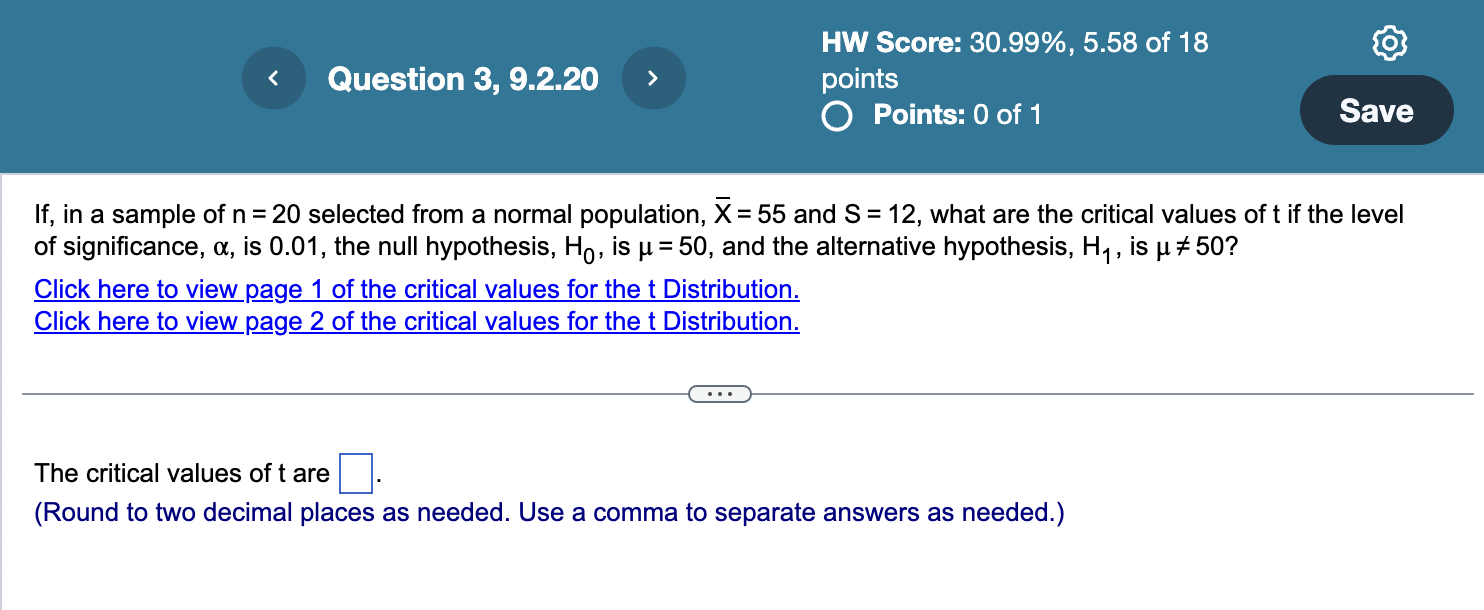
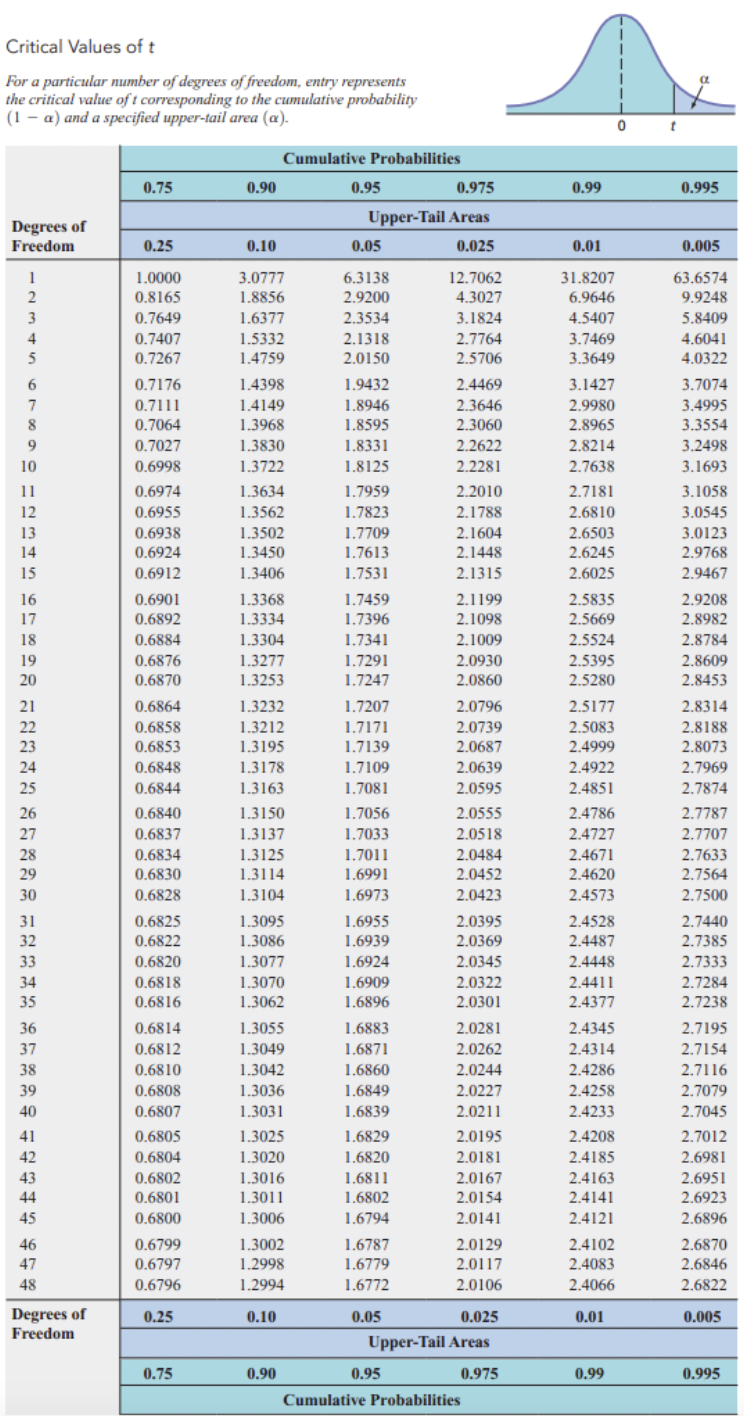
HW Score: 30.99%, 5.58 of 18 Question 3, 9.2.20 points QO Points: 0 of 1 If, in a sample of n =20 selected from a normal population, X=55and S= 12, what are the critical values of t if the level of significance, , is 0.01, the null hypothesis, Hy, is i =350, and the alternative hypothesis, H,, is p# 507 Click here to view page 1 of the critical values for the t Distribution. Click here to view page 2 of the critical values for the t Distribution. _ -5 The critical values of t are |:| (Round to two decimal places as needed. Use a comma to separate answers as needed.) Critical Values of t For a particular number of degrees of freedom. entry represents the critical value of t corresponding to the cumulative probability (1 = @) and a specified upper-ail area (). Degrees of - - ST POy e g' Degrees of Freedom 0.75 1.0000 0.8165 0.7649 0.7407 0.7267 0.7176 0.7111 0.7064 0.7027 0.6998 0.6974 0.6955 0.6938 0.6924 0.6912 0.6901 0.6892 0.6884 0.6876 0.6870 0.6864 0.6858 0.6853 0.6848 0.6844 0.6840 0.6837 0.6834 0.6830 0.6828 0.6825 0.6822 0.6820 0.6818 0.6816 0.6814 0.6812 0.6810 0.6808 0.6807 0.6805 0.6804 0.6802 0.6801 0.6800 0.6799 0.6797 0.6796 0.25 0.75 Cumulative Probabilities 0.90 0.95 0.975 pper-Tail Areas 0.10 0.05 0.025 3.0777 6.3138 12.7062 1.8856 2.9200 43027 1.6377 23534 31824 1.5332 2.1318 2.7764 1.4759 2.0150 25706 1.4398 1.9432 2.4469 1.4149 1.8946 23646 1.3968 1.8595 2.3060 1.3830 1.8331 22622 1.3722 1.8125 22281 1.3634 1.7959 22010 1.3562 1.7823 21788 1.3502 1.7709 2.1604 1.3450 1.7613 21448 1.3406 1.7531 21315 1.3368 1.7459 2.1199 13334 1.7396 2.1098 1.3304 1.7341 2.1009 1.3277 1.7291 2.0930 1.3253 1.7247 2.0860 1.3232 1.7207 20796 1.3212 L7171 20739 1.3195 1.7139 2.0687 1.3178 1.7109 2.0639 1.3163 1.7081 2.0595 1.3150 1.7056 2.0555 1.3137 1.7033 20518 1.3125 1.7011 20484 13114 1.6991 2.0452 1.3104 1.6973 20423 1.3095 1.6955 2.0395 1.3086 1.6939 2.0369 1.3077 1.6924 20345 1.3070 1.6909 20322 1.3062 1.6896 2.0301 1.3055 1.6883 2.0281 1.3049 1.6871 2.0262 1.3042 1.6860 20244 1.3036 1.6849 20227 1.3031 1.6839 20211 1.3025 1.6829 20195 1.3020 1.6820 2.0181 1.3016 1.6811 20167 1.3011 1.6802 20154 1.3006 1.6794 20141 1.3002 1.6787 20129 1.2998 1.6779 20117 1.2994 1.6772 20106 0.10 0.05 0.025 Upper-Tail Areas 0.90 0.95 0.975 Cumulative Probabilities 31.8207 6.9646 4.5407 3.7469 3.3649 3.1427 2.9980 2.8965 28214 27638 2.7181 26810 26503 26245 26025 25835 2.5669 2.5524 25395 2.5280 25177 2.5083 2.4999 24922 24851 24786 24727 24671 24620 24573 24528 24487 24448 24411 24377 24345 24314 24286 24258 24233 2.4208 24185 24163 24141 24121 24102 24083 2.4066 63.6574 9.9248 5.8409 4.6041 4.0322 3.7074 3.4995 3.3554 3.2498 3.1693 3.1058 3.0545 3.0123 2.9768 2.9467 2.9208 2.8982 2.8784 2.8609 2.8453 28314 28188 2.8073 2.7969 2.7874 2.7787 2.7707 2.7633 2.7564 2.7500 2.7440 2.7385 2R3 2.7284 2.7238 2. 7195 2.7154 27116 2.7079 2.7045 2.7012 2.6981 2.6951 2.6923 2.6896 2.6870 2.6846 2.6822 \f