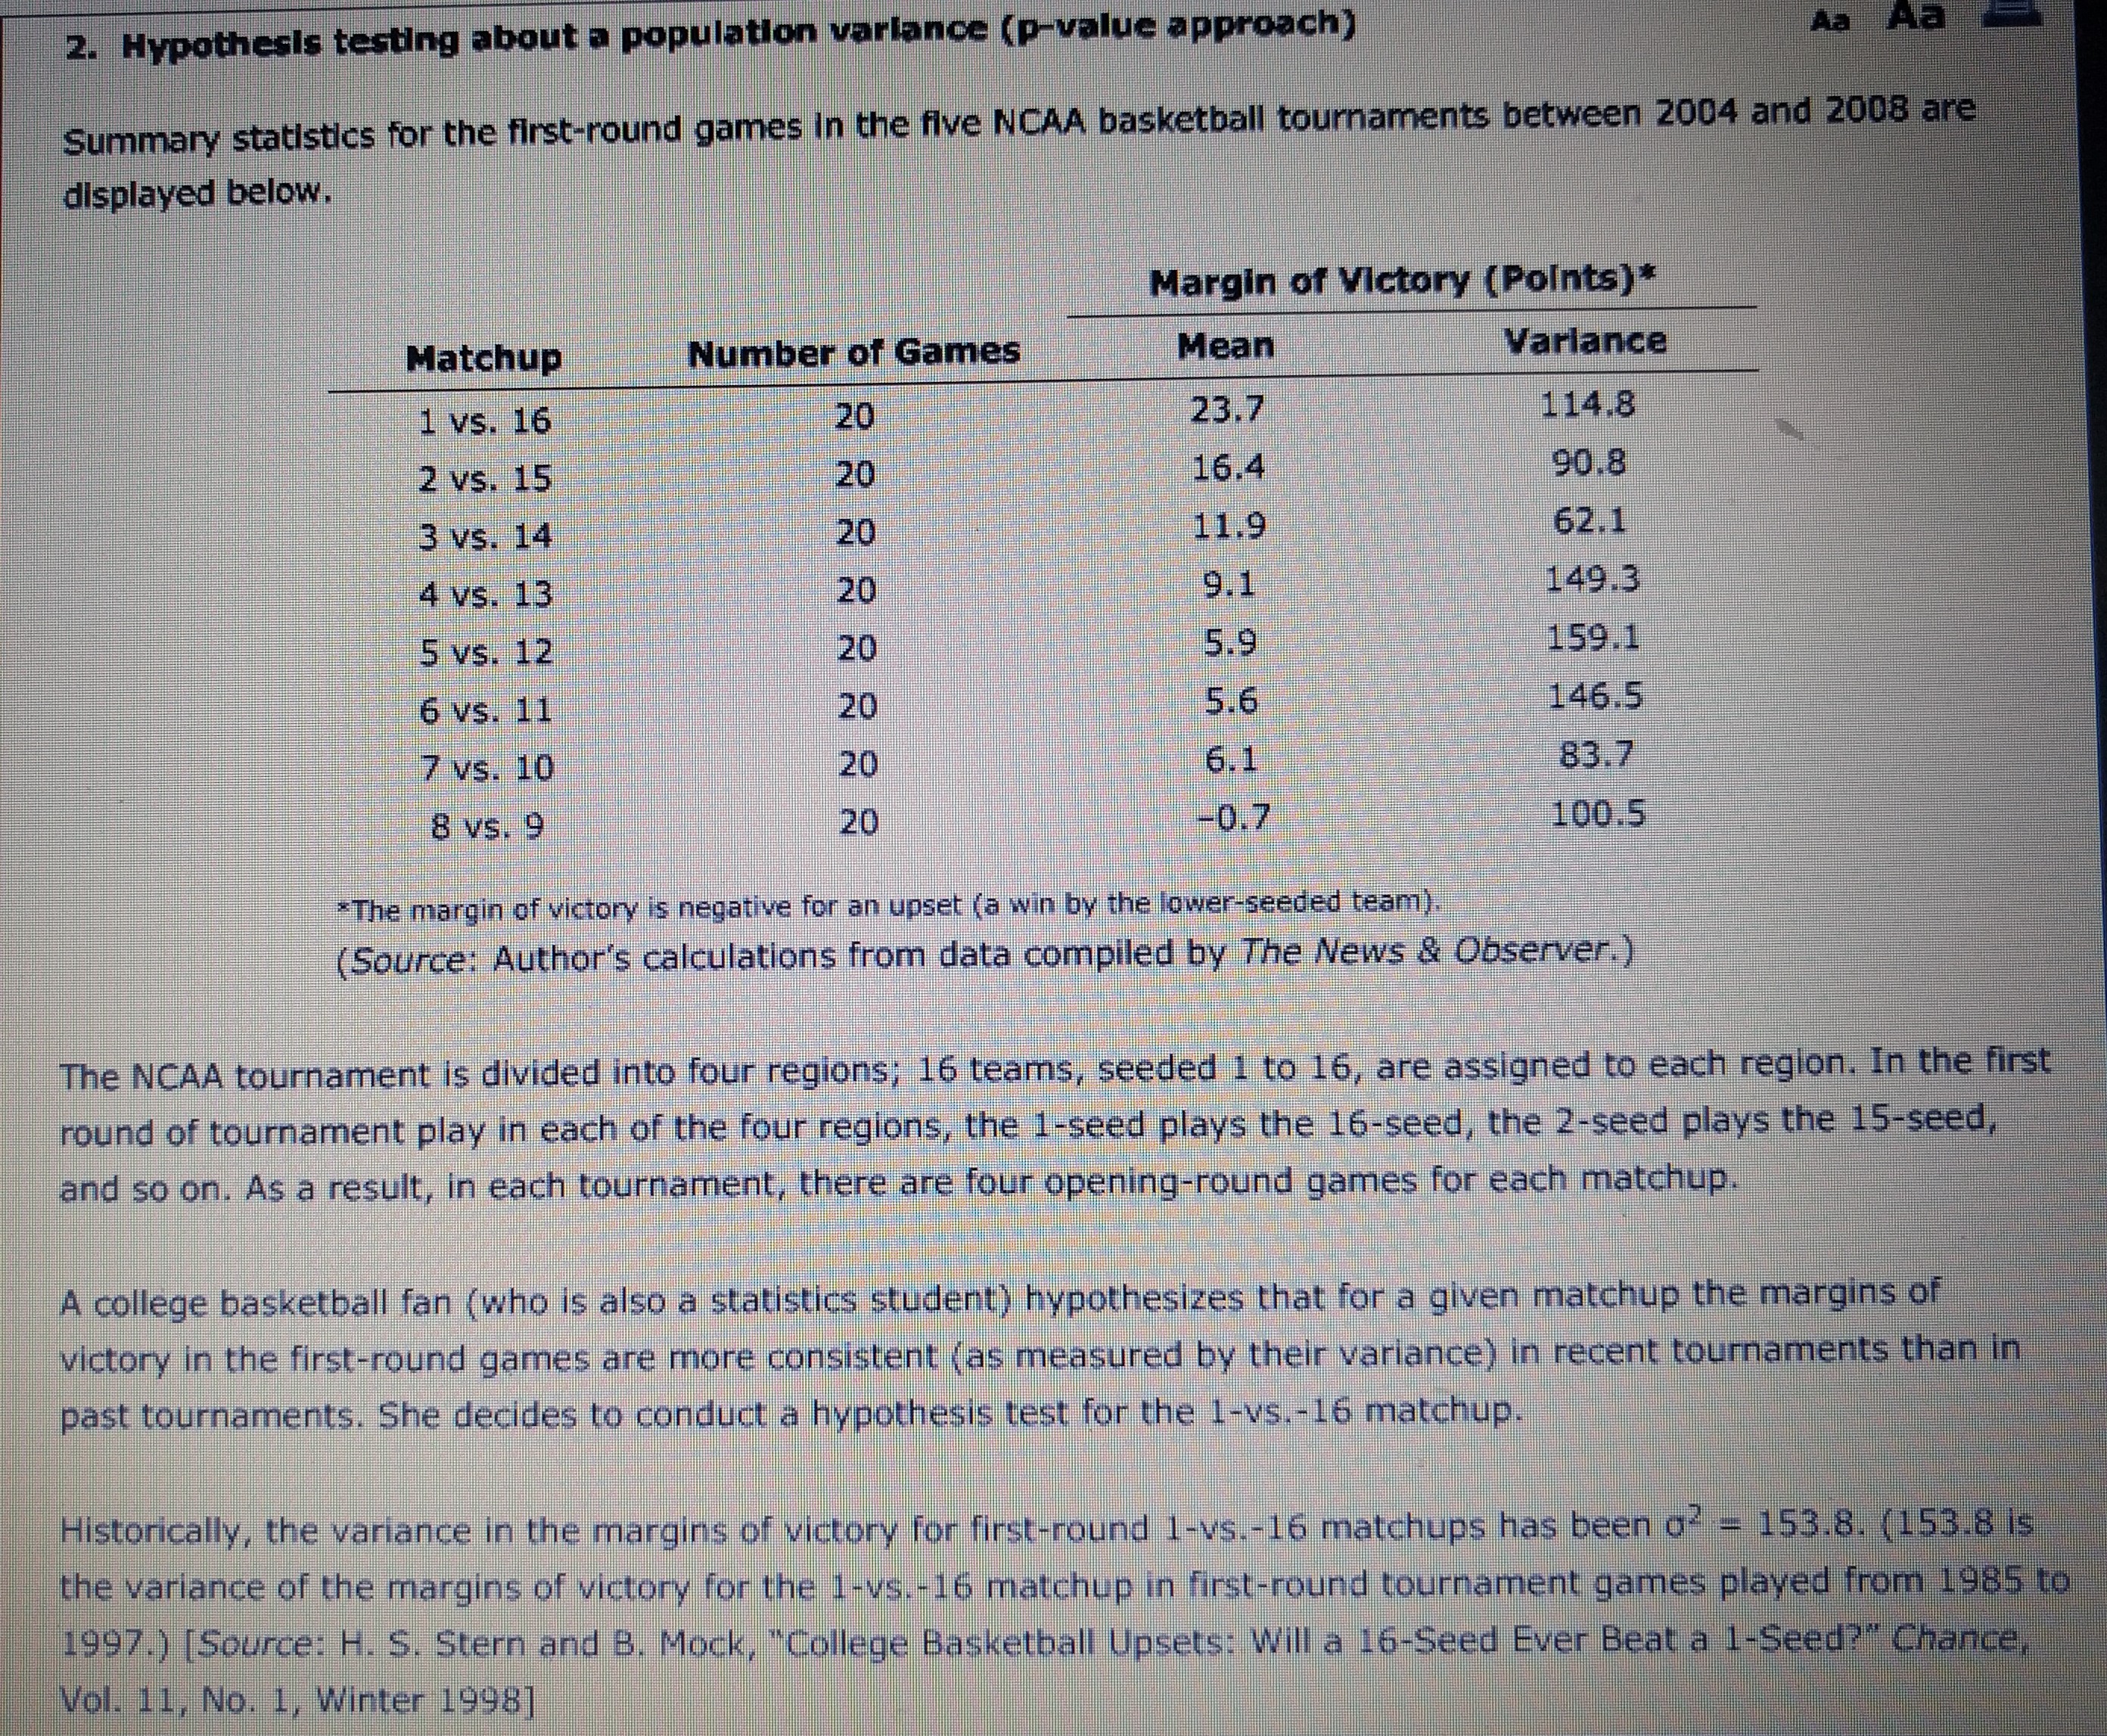
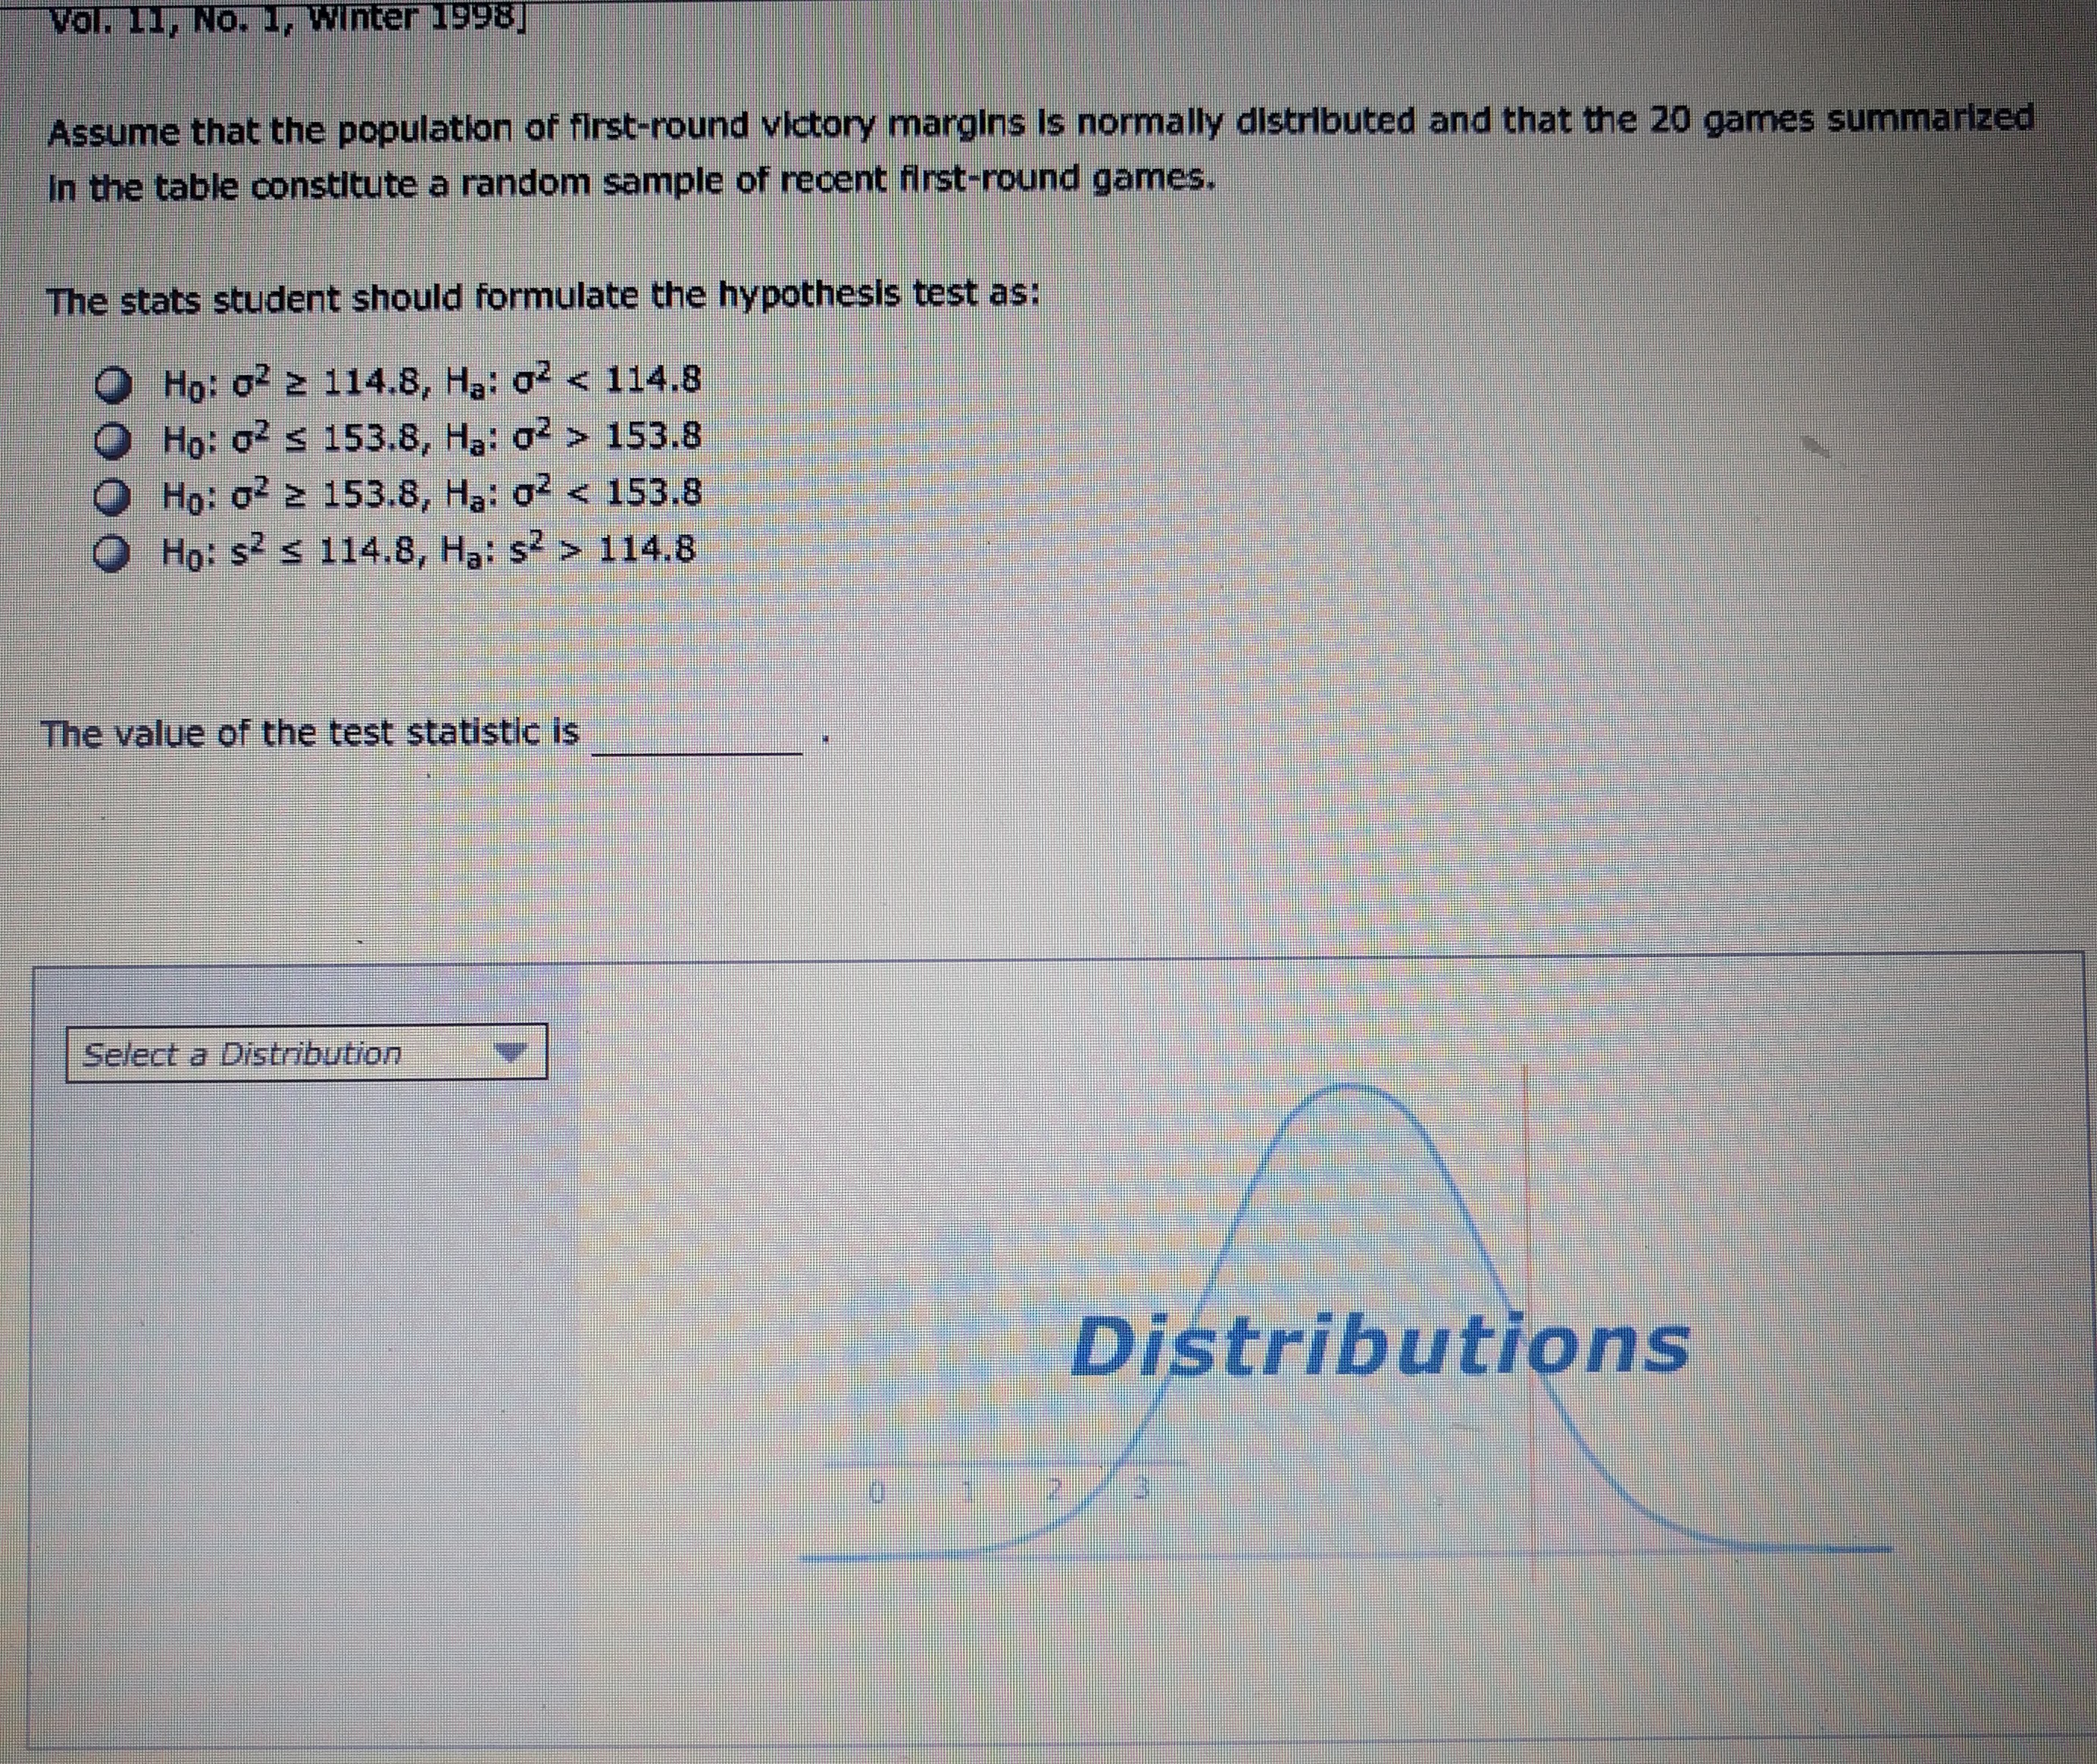
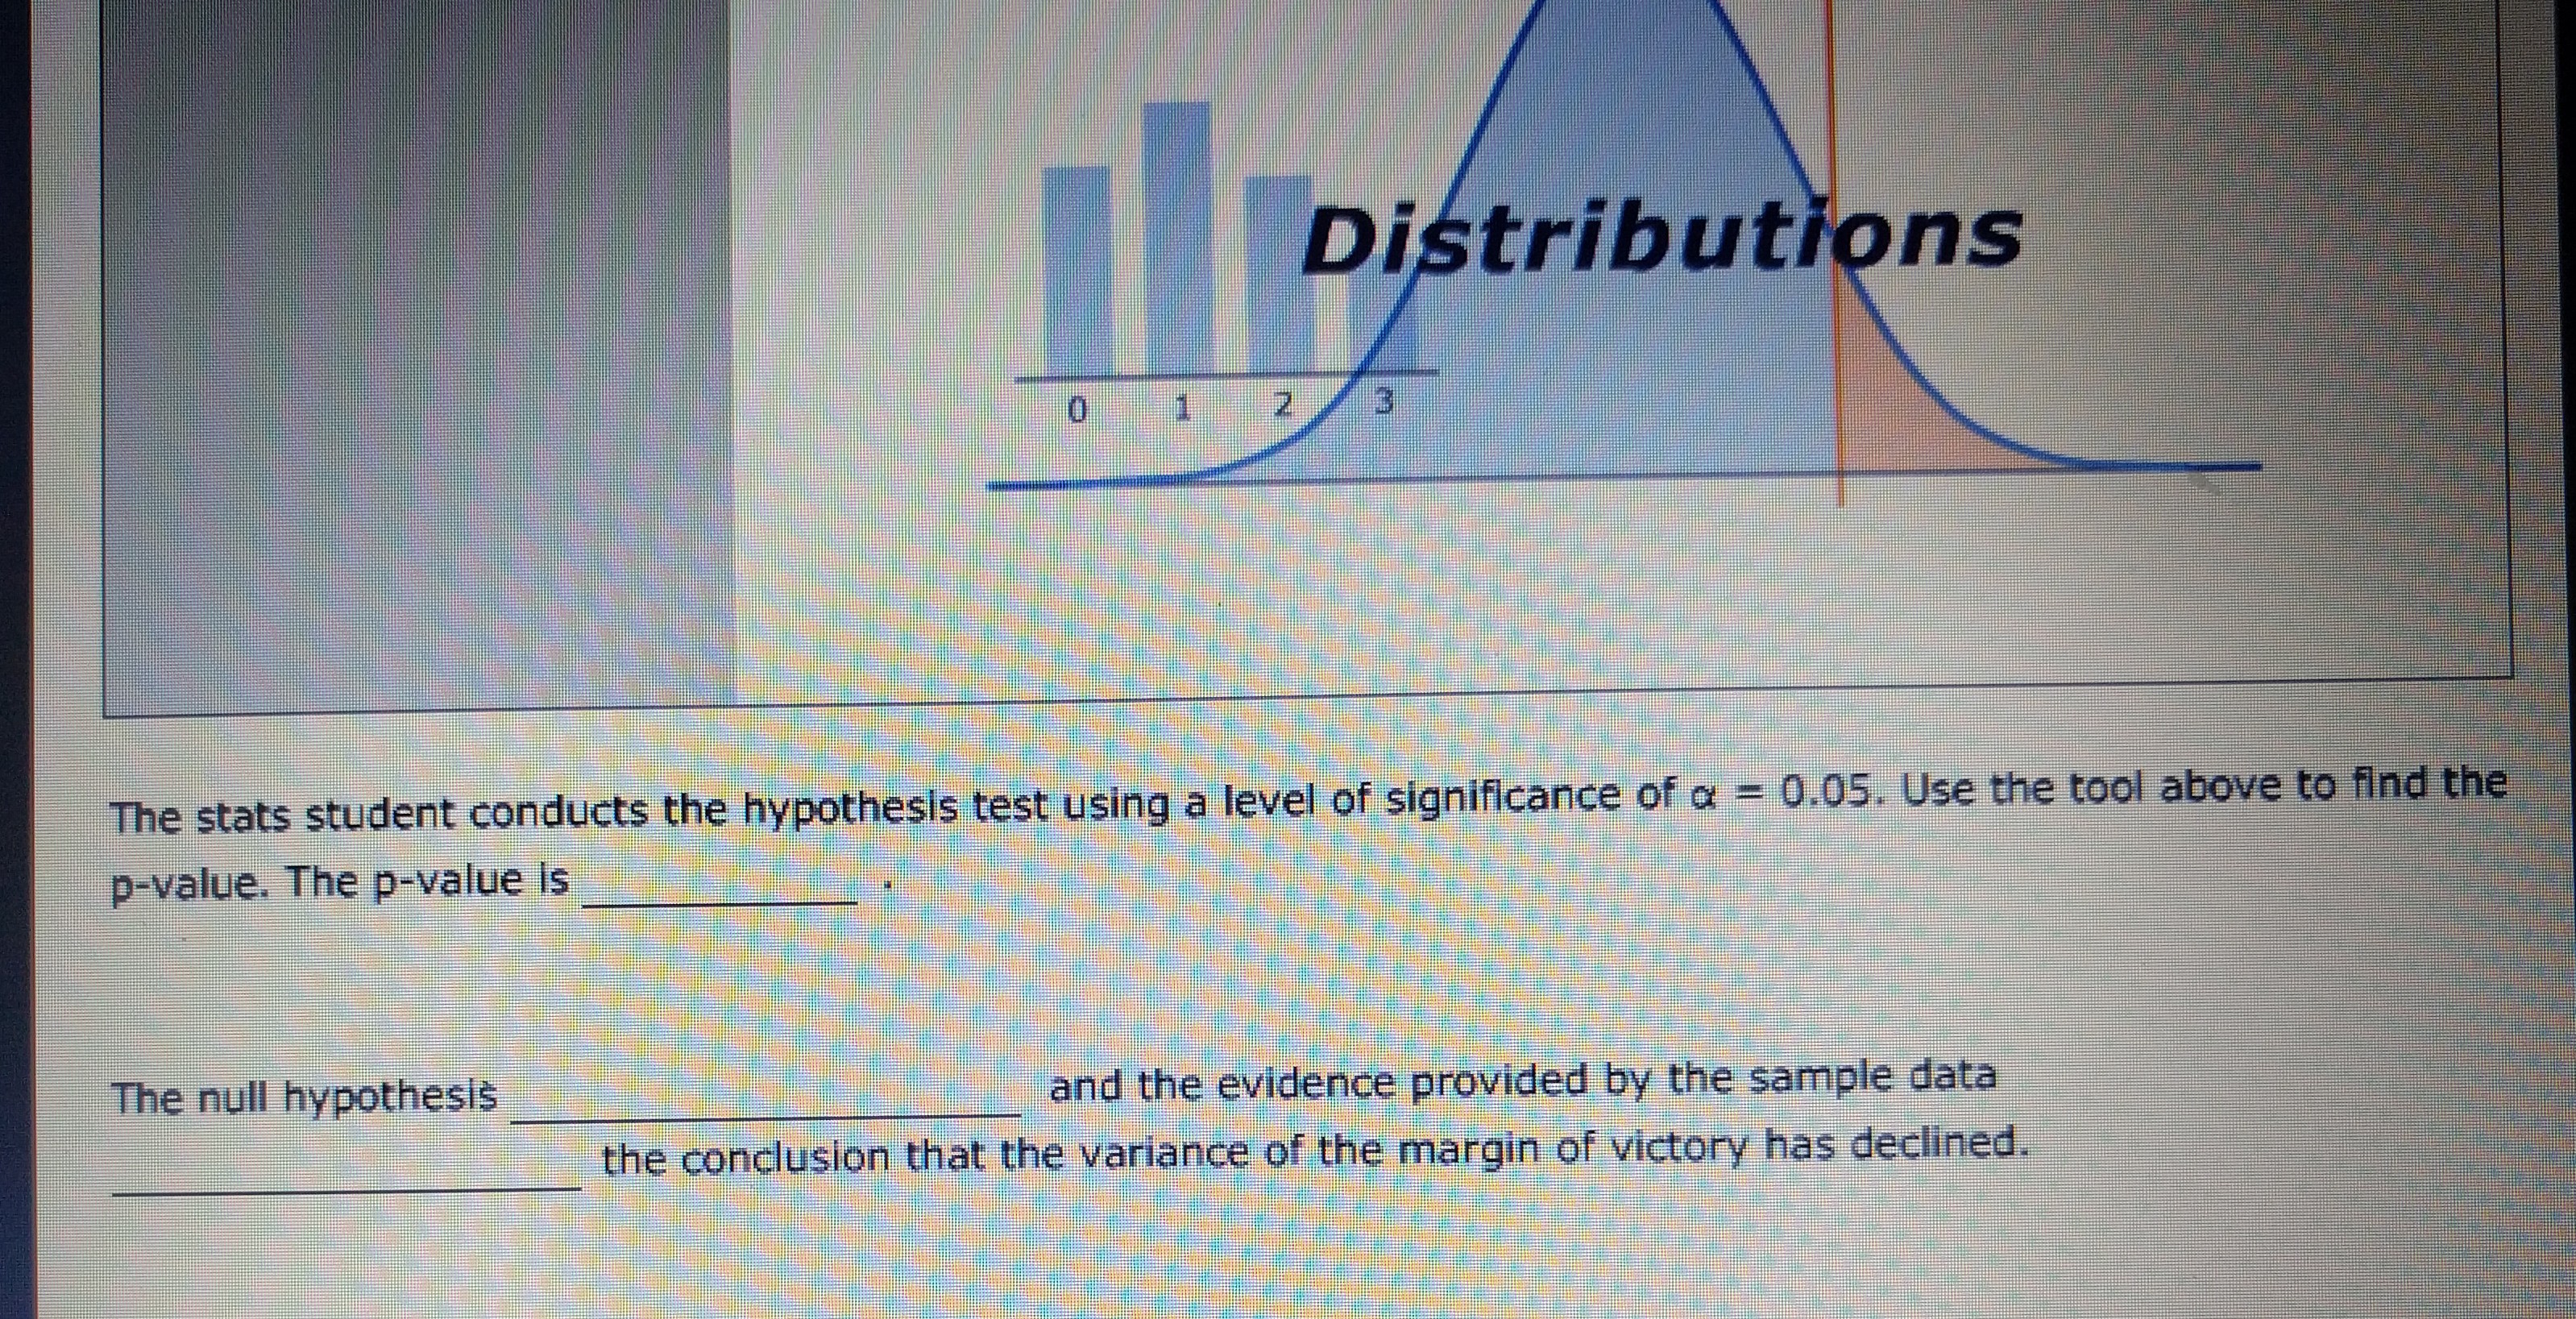
Hypothesis testing about a population variance (p-value approach)
2. Hypothesis testing about a population variance (p-value approach) Summary statistics for the first-round games in the five NCAA basketball tournaments between 2004 and 2008 are displayed below. Margin of Victory (Points)* Matchup Number of Games Mean Variance 1 vs. 16 20 23.7 114.8 2 vs. 15 20 16.4 90.8 3 vs. 14 20 11.9 62.1 4 vs. 13 9.1 149.3 5 vs. 12 5.9 159.1 6 vs. 11 20 5.6 146.5 7 vs. 10 20 83.7 8 vs. 9 20 100.5 The margin of victory is negative for an upset (a win by the lower-seeded team). (Source: Author's calculations from data compiled by The News & Observer.) The NCAA tournament is divided into four regions; 16 teams, seeded 1 to 16, are assigned to each region. In the first round of tournament play in each of the four regions, the 1-seed plays the 16-seed, the 2-seed plays the 15-seed and so on. As a result, in each tournament, there are four opening-round games for each matchup. A college basketball fan (who is also a statistics student) hypothesizes that for a given matchup the margins of victory in the first-round games are more consistent ( as measured by their variance) in recent tournaments than in past tournaments. She decides to conduct a hypothesis test for the 1-vs.-16 matchup. Historically, the variance in the margins of victory for first-round 1-vs.-16 matchups has been o? - 153.8. (153.8 is the variance of the margins of victory for the 1-vs.-16 matchup in first-round tournament games played from 1985 to 1997.) [Source: H. S. Stern and B. Mock, "College Basketball Upsets: Will a 16-Seed Ever Beat a 1-Seed?" Chance, Vol. 11, No. 1, Winter 1998]vol. 11, No. 1, Winter 1998] Assume that the population of first-round victory margins Is normally distributed and that the 20 games summarized In the table constitute a random sample of recent first-round games. The stats student should formulate the hypothesis test as: Ho: 62 2 114.8, Ha: 02 153.8 O Ho: 02 2 153.8, Ha: 02 114.8 The value of the test statistic is Select a Distribution DistributionsDistributions 0 1 2 3 The stats student conducts the hypothesis test using a level of significance of a = 0.05. Use the tool above to find the p-value. The p-value is The null hypothesis and the evidence provided by the sample data the conclusion that the variance of the margin of victory has declined