Answered step by step
Verified Expert Solution
Link Copied!

Question

1 Approved Answer

Hypothesis what type of data it is (e.g., primary or secondary, discrete or continuous) Your conclusion (do the data lead you to confirm or reject

  • Hypothesis
  • what type of data it is (e.g., primary or secondary, discrete or continuous)
  • Your conclusion (do the data lead you to confirm or reject your hypothesis?)

1. two correlation analysis ( scatter plot, line of best fit, correlation coefficient)

2. two-variable analysis in which both variables are qualitative.
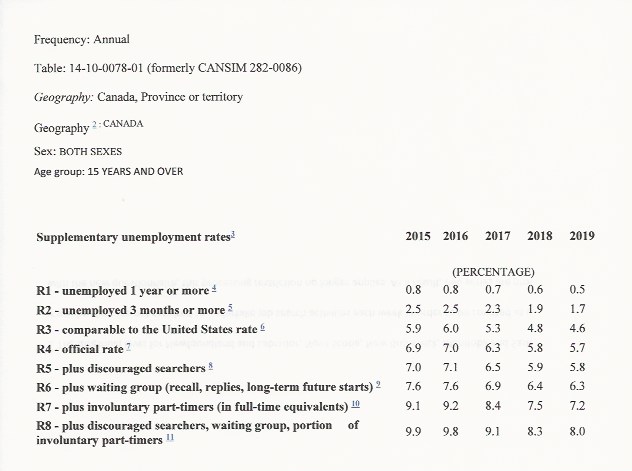
image text in transcribed
Frequency: Annual Table: 14-10-0078-01 (formerly CANSIM 282-0086) Geography: Canada, Province or territory Geography 2 : CANADA Sex: BOTH SEXES Age group: 15 YEARS AND OVER Supplementary unemployment rates' 2015 2016 2017 2018 2019 (PERCENTAGE) R1 - unemployed 1 year or more = 0.8 0.8 0.7 0.6 0.5 R2 - unemployed 3 months or more = 2.5 2.5 2.3 1.9 1.7 R3 - comparable to the United States rate " 5.9 6.0 5.3 4.8 4.6 R4 - official rate ? 6.9 7.0 6.3 5.8 5.7 R5 - plus discouraged searchers 7.0 7.1 6.5 5.9 5.8 R6 - plus waiting group (recall, replies, long-term future starts) 2 7.6 7.6 6.9 6.4 6.3 R7 - plus involuntary part-timers (in full-time equivalents) 10 9.1 9.2 8.4 7.5 7.2 R8 - plus discouraged searchers, waiting group, portion of involuntary part-timers I 9.9 9.8 9. 1 8,3 8.0

Step by Step Solution

There are 3 Steps involved in it

Step: 1

blur-text-image

Get Instant Access to Expert-Tailored Solutions

See step-by-step solutions with expert insights and AI powered tools for academic success

Step: 2

blur-text-image

Step: 3

blur-text-image

Ace Your Homework with AI

Get the answers you need in no time with our AI-driven, step-by-step assistance

Get Started

Recommended Textbook for

Precalculus

Authors: Michael Sullivan

9th edition

321716835, 321716833, 978-0321716835

More Books

Students also viewed these Mathematics questions