I am completing a paper on the Greenhills College case study and needing assistance with adding a couple of visuals. I have attached some of the analytics and the visual(s) can be a graph, chart, figure or table. Would love to have 2 visuals to add to my paper.
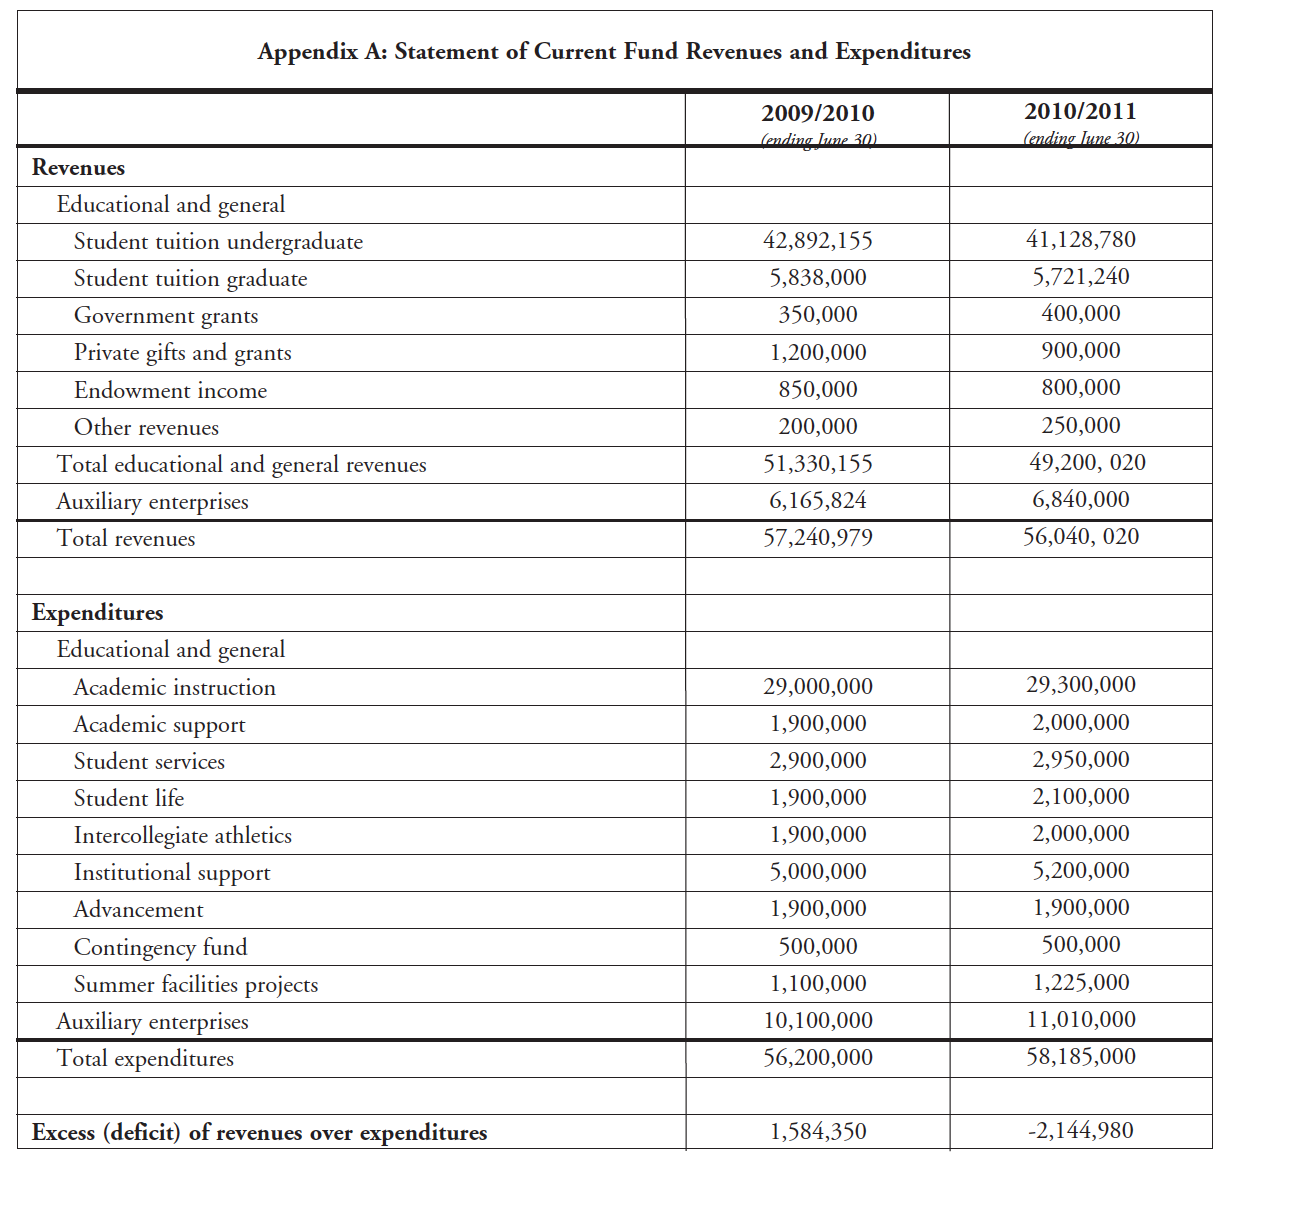
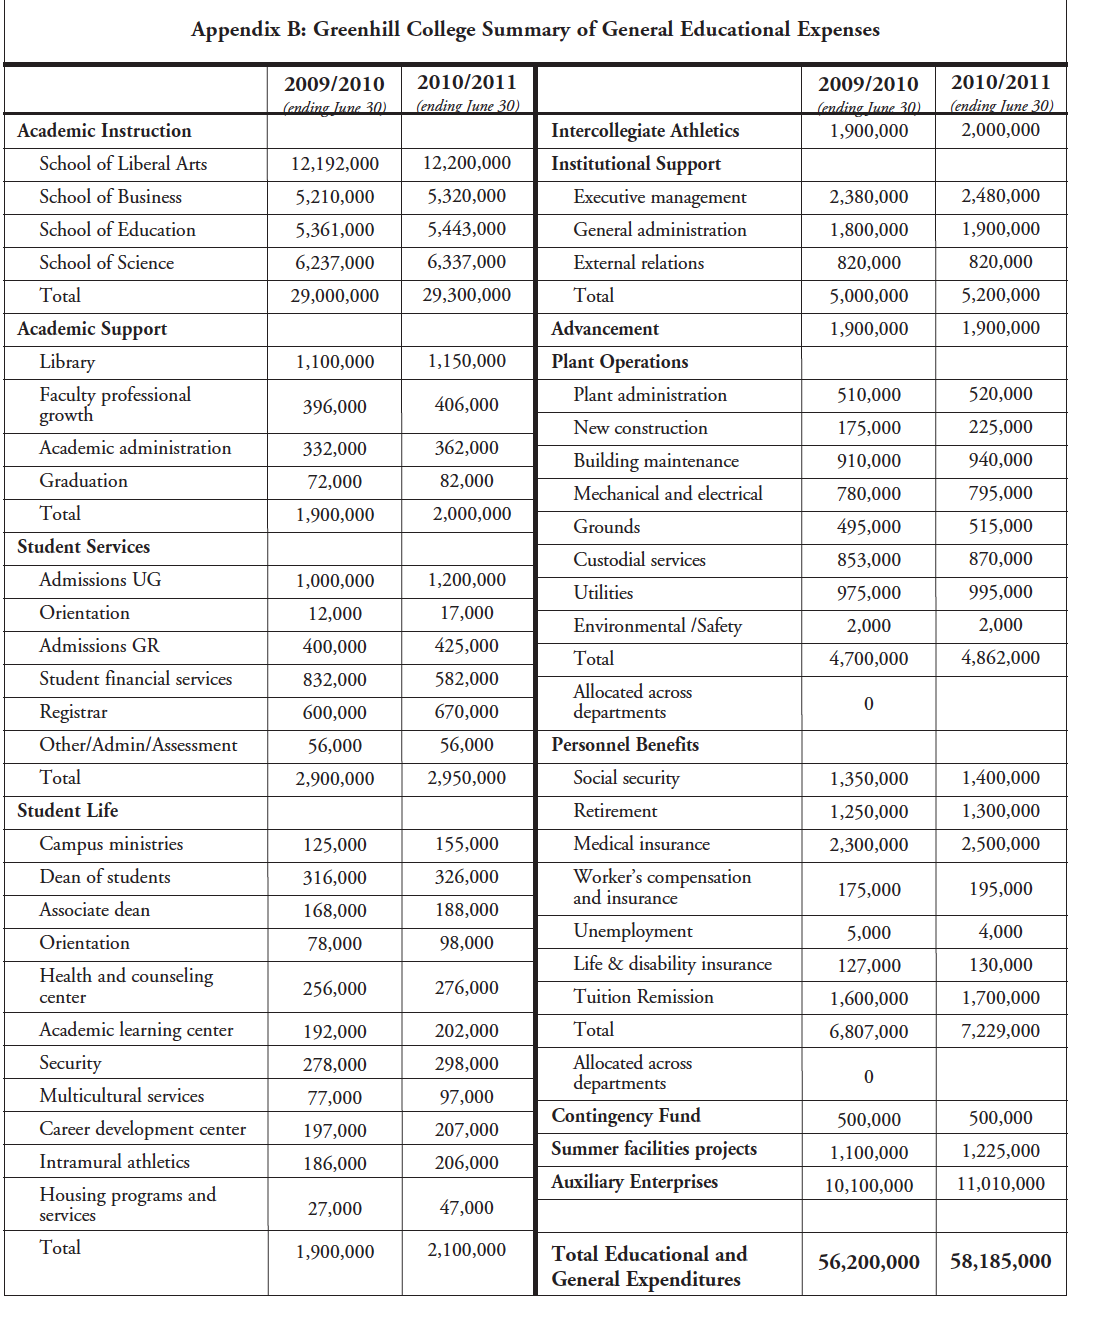
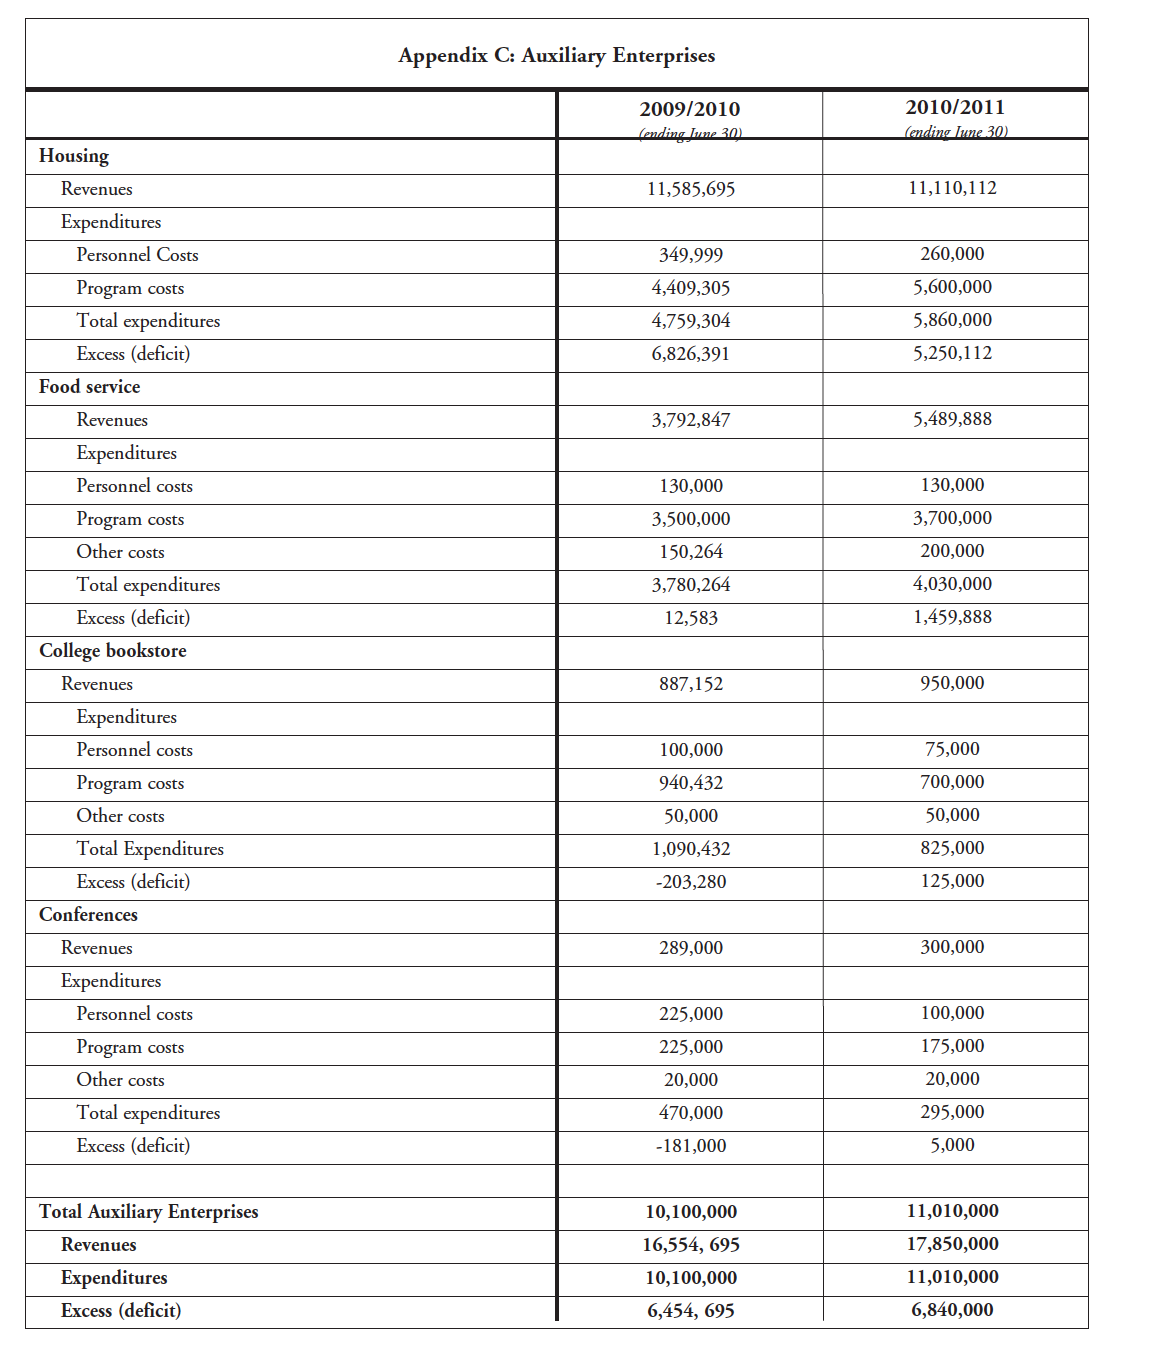
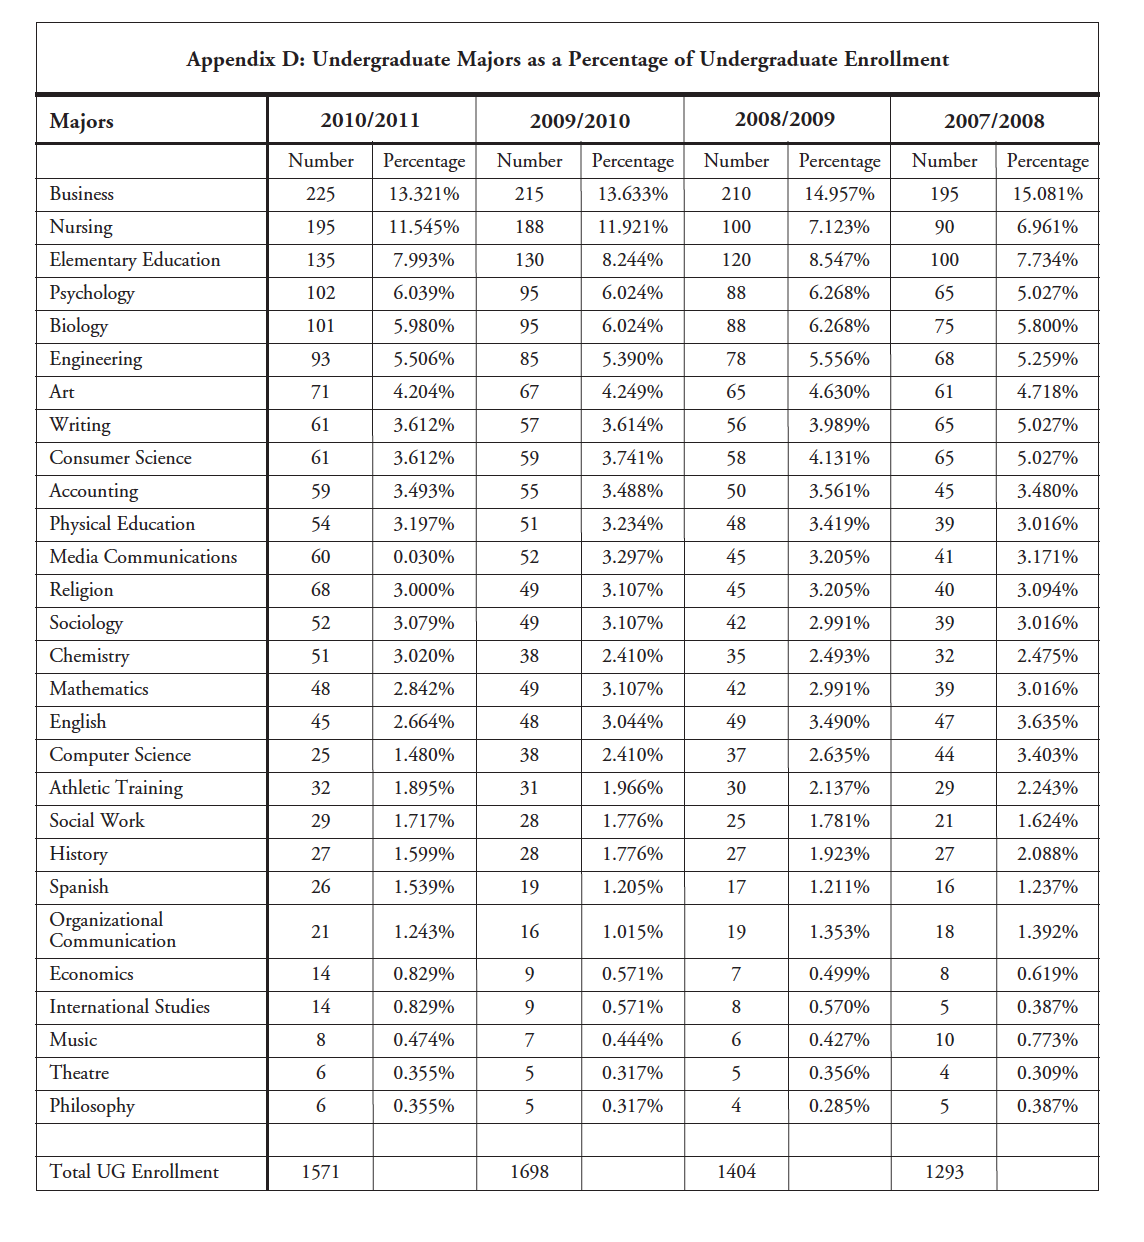
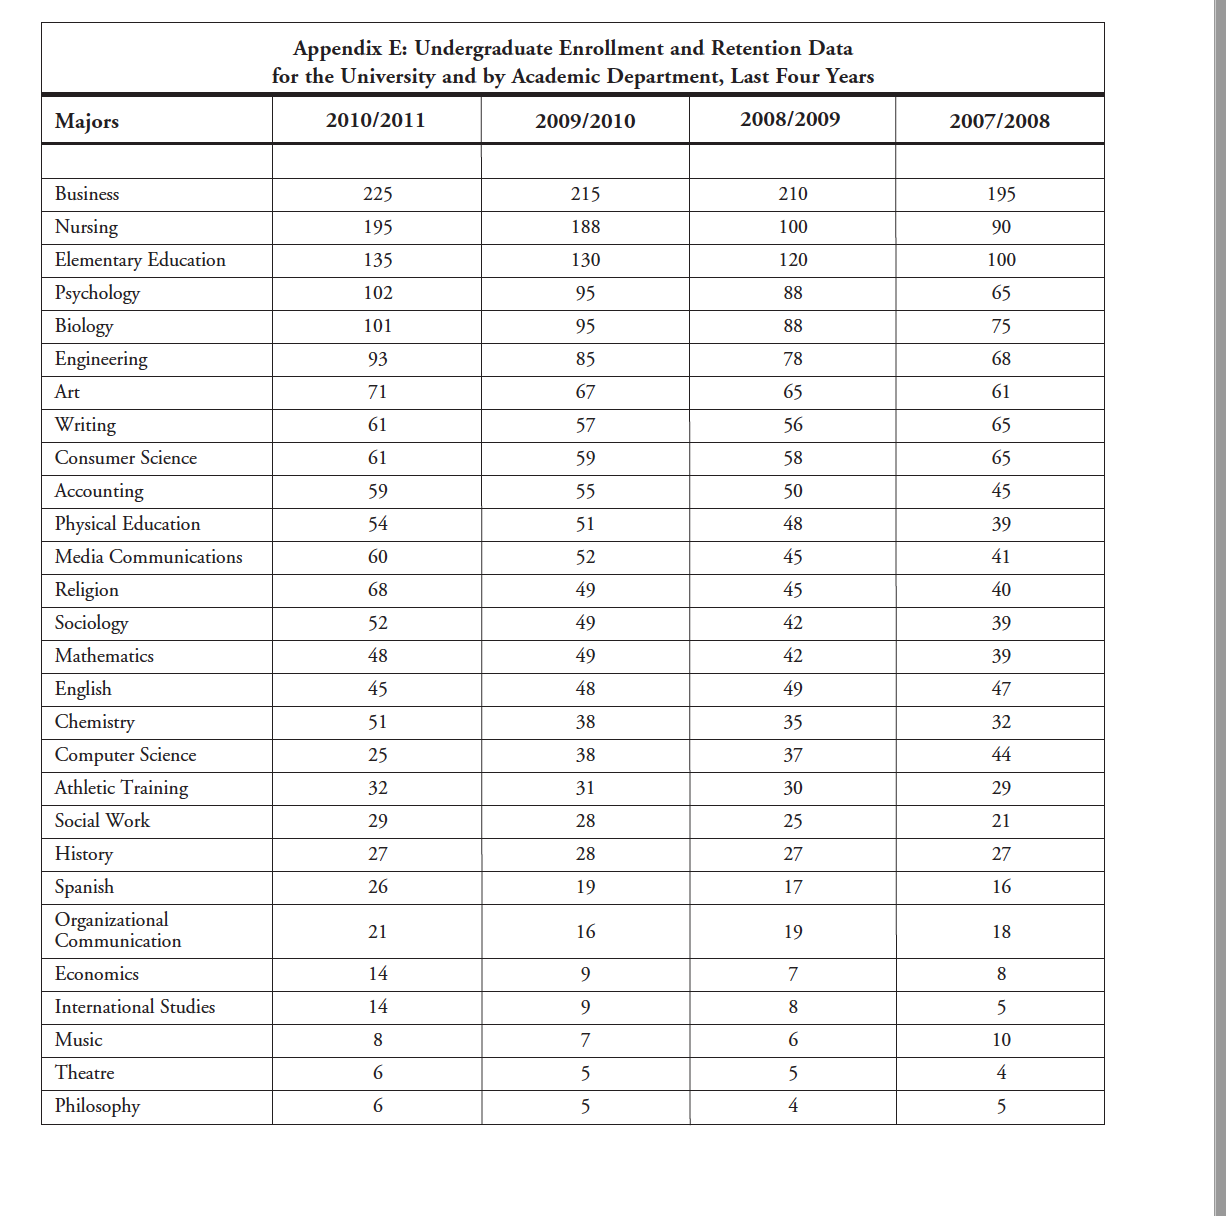
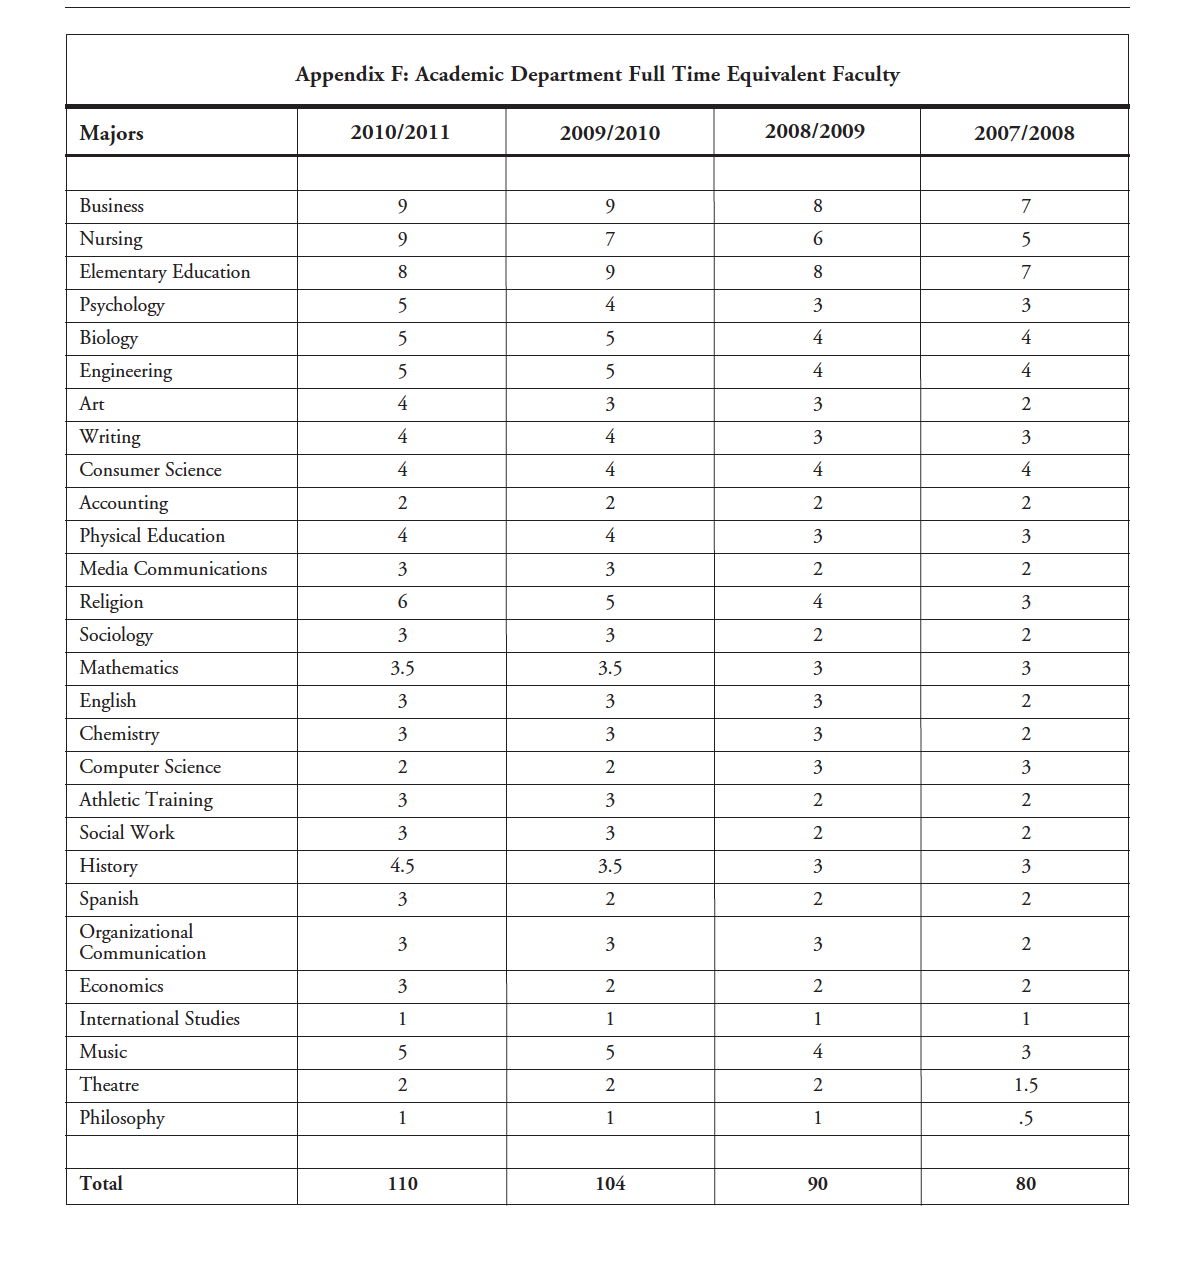
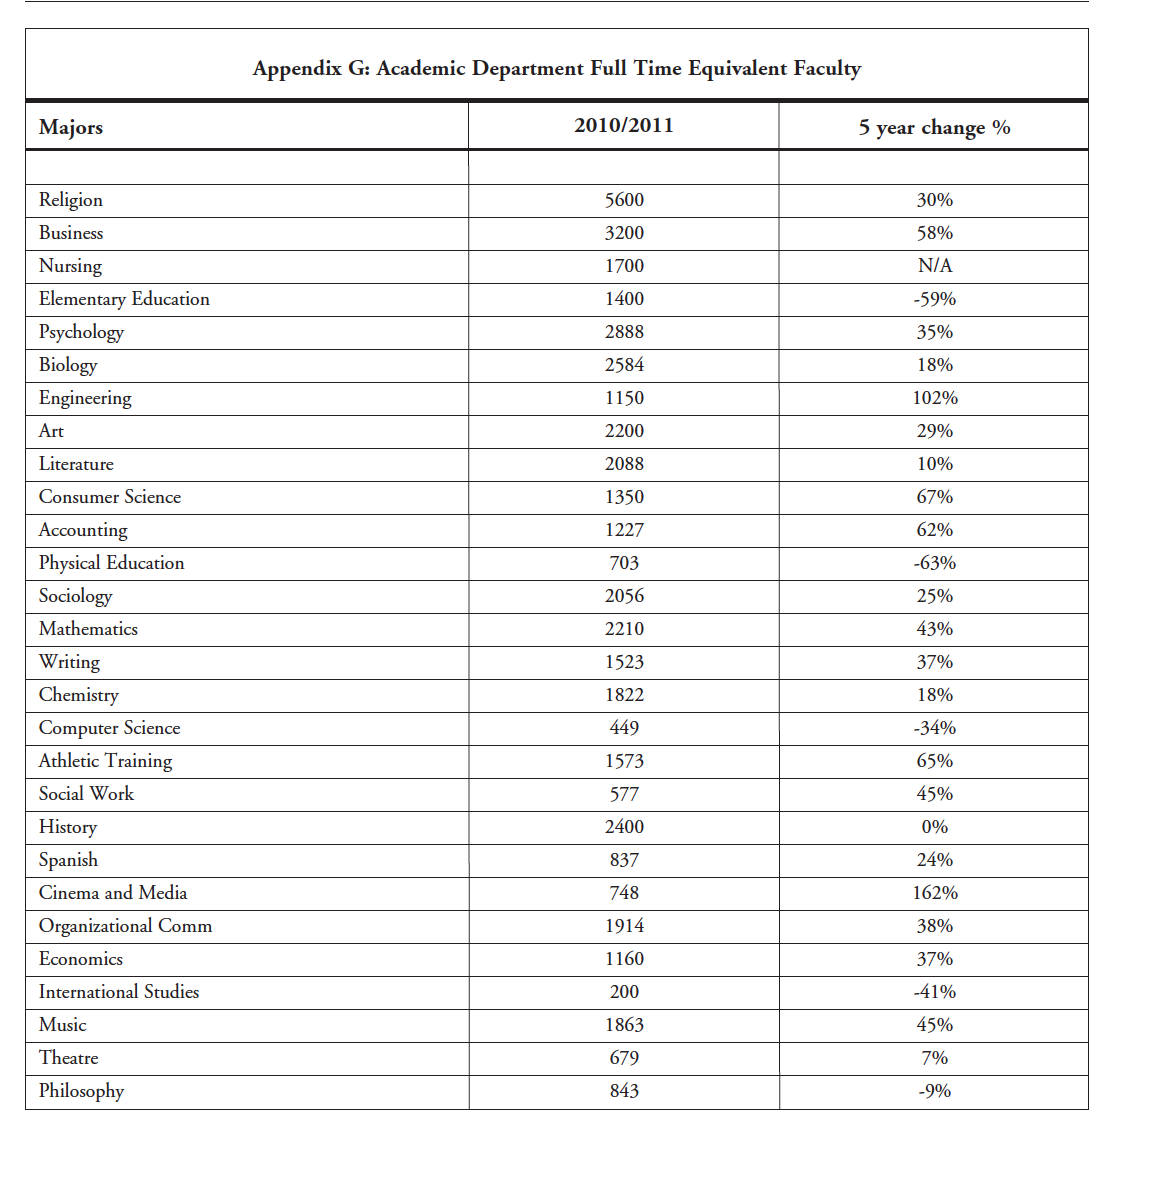
Appendix A: Statement of Current Fund Revenues and. Expenditures 200912010 2010l2011 i I' E i i 5' i :2 Revenues Educational and general Student tuition undergraduate 42,892,155 41,128,730 Student tuition graduate 5,838,000 5,721,240 Government grants 350,000 400,000 Private gifts and grants 1,200,000 900,000 Endowment income 850,000 300,000 Other revenues 200,000 250,000 Total educational and general revenues 51,330,155 49,200, 020 Auxiliary enterprises 6,165,824 6,840,000 Total revenues 57,240,979 56,040, 020 Expenditures Educational and general Academic instruction 29,000,000 29,300,000 Academic support 1,900,000 2,000,000 Student services 2,900,000 2,950,000 Student life 1,900,000 2,100,000 Intercollegiate athletics 1,900,000 2,000,000 Institutional support 5,000,000 5,200,000 Advancement 1 , 900,000 1,900,000 Contingency fund 500,000 500,000 Summer facilities projects 1,100,000 1,225,000 10,100,000 56,200,000 11,010,000 58,185,000 Auxiliary enterprises Total expenditures 1,584,350 4,144,980 Excess (decit) of revenues over expenditures Appendix B: Greenhill College Summary of General Educational Expenses 2009/2010 2010/2011 2009/2010 2010/2011 (ending June 30) (ending June 30) (ending June 30) (ending June 30) Academic Instruction Intercollegiate Athletics 1,900,000 2,000,000 School of Liberal Arts 12,192,000 12,200,000 Institutional Support School of Business 5,210,000 5,320,000 Executive management 2,380,000 2,480,000 School of Education 5,361,000 5,443,000 General administration 1,800,000 1,900,000 School of Science 5,237,000 6,337,000 External relations 320,000 320,000 Total 29,000,000 29,300,000 Total 5,000,000 5,200,000 Academic Support Advancement 1,900,000 1,900,000 Library 1,100,000 1,150,000 Plant Operations Faculty professional Plant administration 510,000 20,000 growth 396,000 406,000 Academic administration 362,000 New construction 175,000 225,000 332,000 940,000 Graduation 72,000 Building maintenance 910,000 82,000 Mechanical and electrical 780,000 795,000 Total 1,900,000 2,000,000 Student Services Grounds 495,000 515,000 Admissions UG Custodial services 853,000 870,000 1,000,000 1,200,000 Utilities 975,000 95,000 Orientation 2,000 17,000 Admissions GR Environmental /Safety 2,000 2,000 400,000 425,000 Student financial services Total +,700,000 4,862,000 832,000 582,000 Registrar Allocated across 600,000 670,000 departments 0 Other/Admin/Assessment 56,000 56,000 Personnel Benefits Tota 2,900,000 2,950,000 Social security 1,350,000 ,400,000 Student Life Retirement ,250,000 1,300,000 Campus ministries 125,000 155,000 Medical insurance 2,300,000 2,500,000 Dean of students 316,000 326,000 Worker's compensation 195,000 Associate dean 168,000 188,000 and insurance 175,000 Orientation 78,000 98,000 Unemployment 5,000 4,000 Health and counseling Life & disability insurance 127,000 130,000 center 256,000 276,000 Tuition Remission 1,600,000 1,700,000 Academic learning center 192,000 202,000 Tota 5,807,000 7,229,000 Security 278,000 298,000 Allocated across department 0 Multicultural services 77,000 97,000 Career development center 197,000 207,000 Contingency Fund 500,000 500,000 Intramural athletics 186,000 206,000 Summer facilities projects 1,100,000 1,225,000 Housing programs and Auxiliary Enterprises 10,100,000 1 1,010,000 services 27,000 47,000 Total 1,900,000 2,100,000 Total Educational and General Expenditures 56,200,000 58,185,000Appendix C: Auxiliary Enterprises 2009/2010 2010/2011 (ending June 30) (ending June 30) Housing Revenues 1 1,585,695 11,110,112 Expenditures Personnel Costs 349,999 260,000 Program costs 4,409,305 5,600,000 Total expenditures 4,759,304 5,860,000 Excess (deficit) 6,826,391 5,250,112 Food service Revenues 3,792,847 5,489,888 Expenditures Personnel costs 130,000 130,000 Program costs 3,500,000 3,700,000 Other cost 150,264 200,000 Total expenditures 3,780,264 4,030,000 Excess (deficit) 12,583 1,459,888 College bookstore Revenues 887,152 950,000 Expenditures Personnel costs 100,000 75,000 Program costs 940,432 700,000 Other costs 50,000 50,000 Total Expenditures 1,090,432 825,000 Excess (deficit) 203,280 125,000 Conferences Revenues 289,000 300,000 Expenditures Personnel costs 225,000 100,000 Program costs 225,000 175,000 Other costs 20,000 20,000 Total expenditures 470,000 295,000 Excess (deficit) -181,000 5,000 Total Auxiliary Enterprises 10,100,000 11,010,000 Revenues 16,554, 695 17,850,000 Expenditures 10,100,000 1,010,000 Excess (deficit) 6,454, 695 6,840,000Appendix D: Undergraduate Majors as 21 Percentage of Undergraduate Enrollment 00000000 00000000 Number Percentage Number Percentage Percentage Business 13.32196 13.63396 15.08196 Nursing 11.54596 11.92196 7.12396 90 6.96196 Elementary Education 7.99396 130 8.24496 120 8. 54796 100 7.73496 Psychology 102 6.03996 95 6.02496 88 6.26 896 65 5.02796 Biology 5.98096 6.02496 6.26896 75 5.80096 Engineering 5.50696 5.39096 555696 68 5.25996 Art 71 4.20496 67 4.24996 65 4.63096 61 4.71896 Writing 61 3.61296 57 3.61496 56 3.98996 65 5.02796 Consumer Science 61 3.61296 59 3.74196 58 4.13196 65 5.02796 Accounting 59 3.49396 55 3.48896 50 3.56196 45 3.48096 Physical Education 54 3.19796 51 3.23496 48 3.41996 39 3.01696 Media Communications 60 0.03096 52 3.29796 45 3.20596 41 3.17196 Religion 68 3.00096 49 3.10796 45 3.20596 40 3.09496 Sociology 52 3.07996 49 3.10796 42 2.99196 39 3.01696 Chemistry 51 3.02096 38 2.41096 35 2.49396 32 2.47596 Mathematics 48 2.84296 49 3.10796 42 2.99196 39 3.01696 English 45 2.66496 48 3.04496 49 3.49096 47 3.63 596 Computer Science 25 1.48096 38 2.41096 37 2.63596 44 3.40396 Athletic Training 32 1.89596 31 1.96696 30 2.13796 29 2.24396 Social Work 29 1.71796 28 1.77696 25 1.78196 21 1.62496 History 27 1.59996 28 1.77696 27 1.92396 27 2.08896 Spanish 26 1.53996 19 1.20596 17 1.21196 16 1.23796 80731111511112.1801... 21 1.243% 16 1.015% 19 1.353% 13 1.392% Economics 14 0.82996 9 0.57196 7 0.49996 8 0.61996 International Studies 14 0.82996 9 0.57196 8 0.57096 5 0.38796 Music 8 0.47496 7 0.44496 6 0.42796 10 0.77396 Theatre 6 0.355% 5 0.31796 5 0.35696 4 0.30996 Philosophy 6 0.35596 5 0.31796 4 0.28596 5 0.38796 Total UG Enrollment 1571 1698 1404 1293 Appendix E: Undergraduate Enrollment and Retention Data for the University and by Academic Department, Last Four Years Majors 2010! 201 1 200912010 200812009 2007/2008 Business 225 215 210 195 Nursing 195 188 100 90 Elementary Education 135 130 120 100 Psychology 102 95 88 65 Biology 101 95 88 75 Engineering 93 85 78 68 Art 71 67 65 61 Writing 61 57 56 65 Consumer Science 61 59 58 65 Acooun ting 59 55 50 45 Physical Edumtion 54 5] 48 39 Media Communications 60 52 45 41 Religion 68 49 45 40 Sociology 52 49 42 39 Mathematics 48 49 42 39 English 45 48 49 47 Chemistry 51 38 35 32 Computer Science 25 38 37 4-4 Athletic Training 3 2 3] 30 29 Social Work 29 28 25 2 1 History 27 28 27 27 Spanish 2 6 1 9 17 16 8322:3233; 21 16 19 18 Economics 14 9 7 8 International Studies 14 9 8 5 Music 8 7 6 10 Theatre 6 5 5 4 Philosophy 6 5 4 5 Appendix F: Academic Department Full Time Equivalent Faculty Majors 2010/2011 2009/2010 2008/2009 2007/2008 Business 9 8 7 Nursing 9 6 5 Elementary Education 8 9 8 7 Psychology 5 3 Biology 5 Engineering Art Writing Consumer Science 4 Accounting IN Physical Education Media Communications Religion 6 Sociology 3 Mathematics 3.5 English Chemistry 3 Computer Science 2 Athletic Training 3 Social Work 3 History 4.5 Spanish IN W N N W W W W N A N W N A W W A A Organizational Communication Economics IN International Studies 5 W - N Theatre - NU- NW IN W N N W N N W N W N W N A WNAA Musi N 1.5 Philosophy 1 - NA - .5 Total 110 104 90 80Appendix G: Academic Department Full Time Equivalent Faculty Majors 2'0 1 0120 1 1 5 year change % Religion 5600 30% Business 3200 58% Nursing 1700 NIA Elementary Education 1400 69% Psychology 2833 35% Biology 2584 1 8% Engineering 1 150 102% Art 2200 29% literature 2033 10% Consumer Science 1350 67% Acooun ting 1227 62% Physical Education 703 -63% Sociology 2056 25% Mathematics 2210 43% Writing 1 523 37% Chemistry 1 822 1 8% Computer Science 449 64% Athletic Training 1573 65% Social Work 577 45% History 2400 0% Spanish 837 24% Cinema and Media 748 162% Organizational Comm 1914 38% Economics 1 160 37% International Studies 200 -41% Music 1 863 45% Theatre 679 7% Philosophy 843 -9%