

I am doing an single linear regression analysis of a sample of 210 observations that was randomly selected from an excel file. The dependent variable
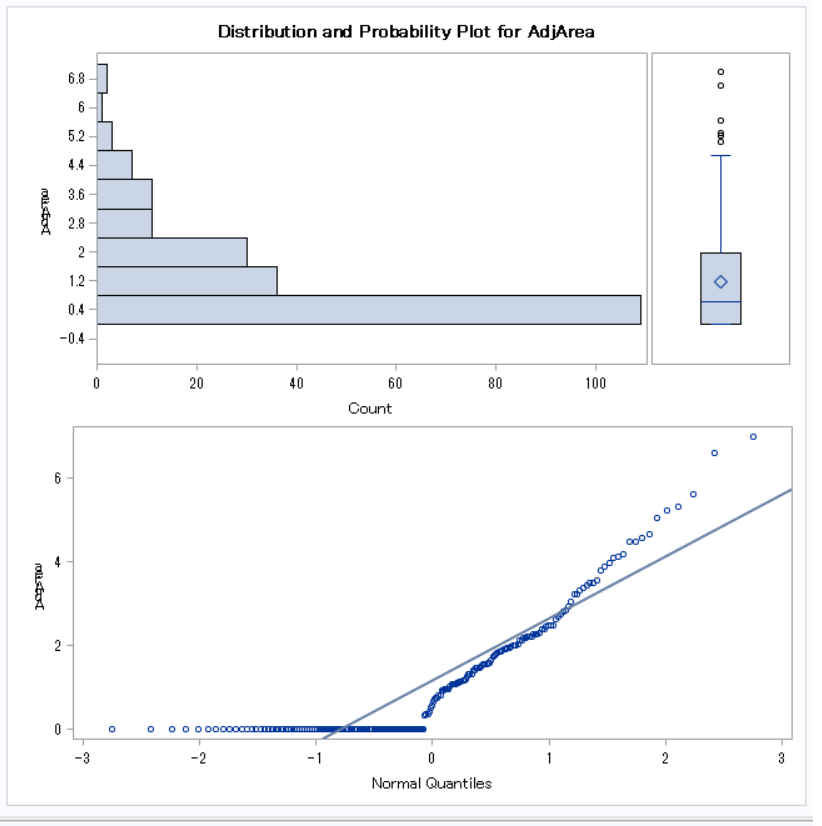
I am doing an single linear regression analysis of a sample of 210 observations that was randomly selected from an excel file. The dependent variable has many zero values keeps generating such graphs that are by no means normal.
Can I keep using these graphs?
The response variable is Area. I tried to apply a transformation and created a new variable: AdjArea = Log(Area+1) as the new dependent variable.
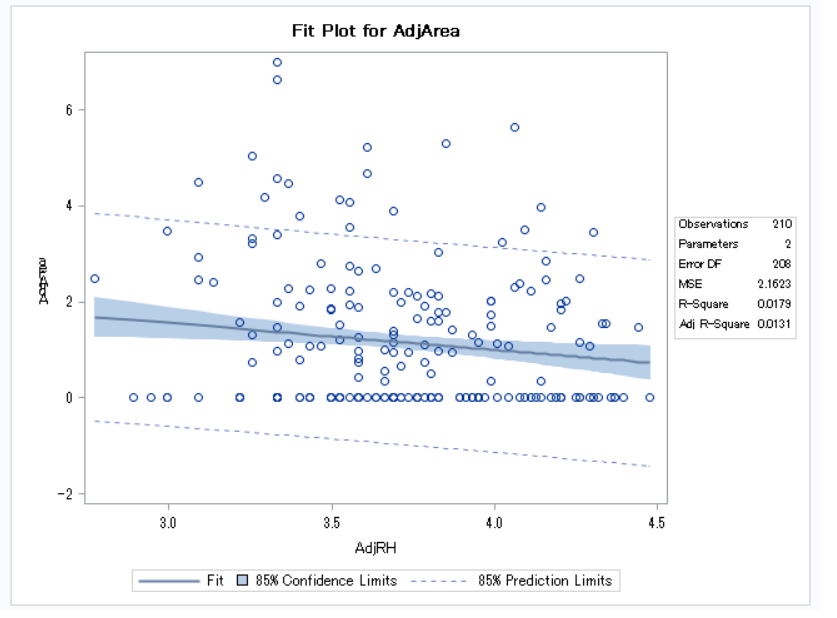
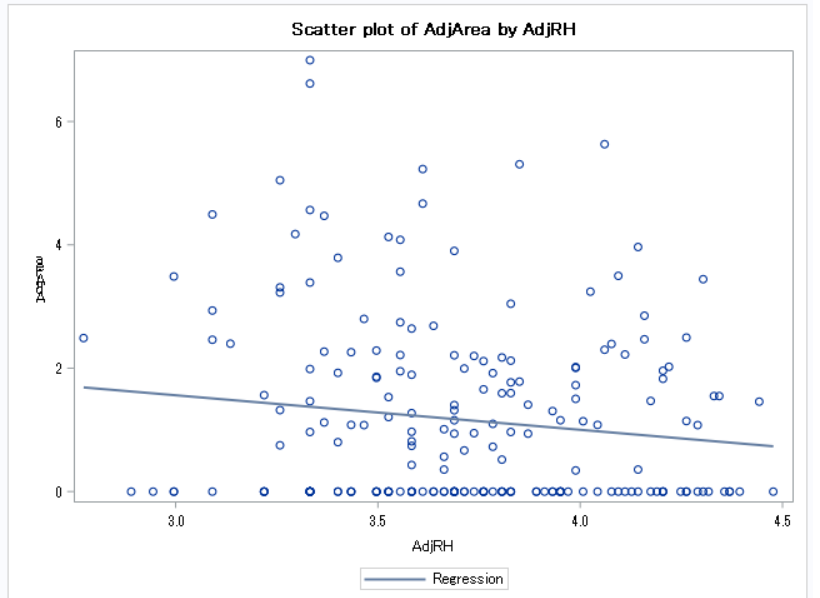
I applied the same transformation for the independent variable of RH. The new independent variable is AdjRH = Log(RH+1). There is always a horizontal line generated from the zero values of the dependent variable.
As an alternative way to solve the problem, will it be acceptable for me to separate the data set into two parts, where one part only has non-zero response variables and the other part has only zero-value response variables?
Step by Step Solution
There are 3 Steps involved in it
Step: 1

See step-by-step solutions with expert insights and AI powered tools for academic success
Step: 2

Step: 3
Ace Your Homework with AI
Get the answers you need in no time with our AI-driven, step-by-step assistance
Get Started
Authors: David C. Lay
4th edition
321791541, 978-0321388834, 978-0321791542