

Question
I am given a Matlab m-file to load onto Matlab and perform the following Part A: Write a script that will: load the file accdata.mat
I am given a Matlab m-file to load onto Matlab and perform the following
Part A:
Write a script that will:
- load the file accdata.mat
- find the resultant acceleration value for each sample
- plot the y vector and resultant vector on the same graph
- calculate and display the amount of time represented by the data
The resultant acceleration data should be stored in a vector of data the same length as x, y, and z
In order to determine the magnitude of the resultant acceleration, you will need to use a 3-dimensional version of the Pythagorean theorem
The data I am given is loaded onto my workspace as three separate vectors, xaccdata, yaccdata and zacdata each with a value of 1x1101 and this graph attached as a pdf
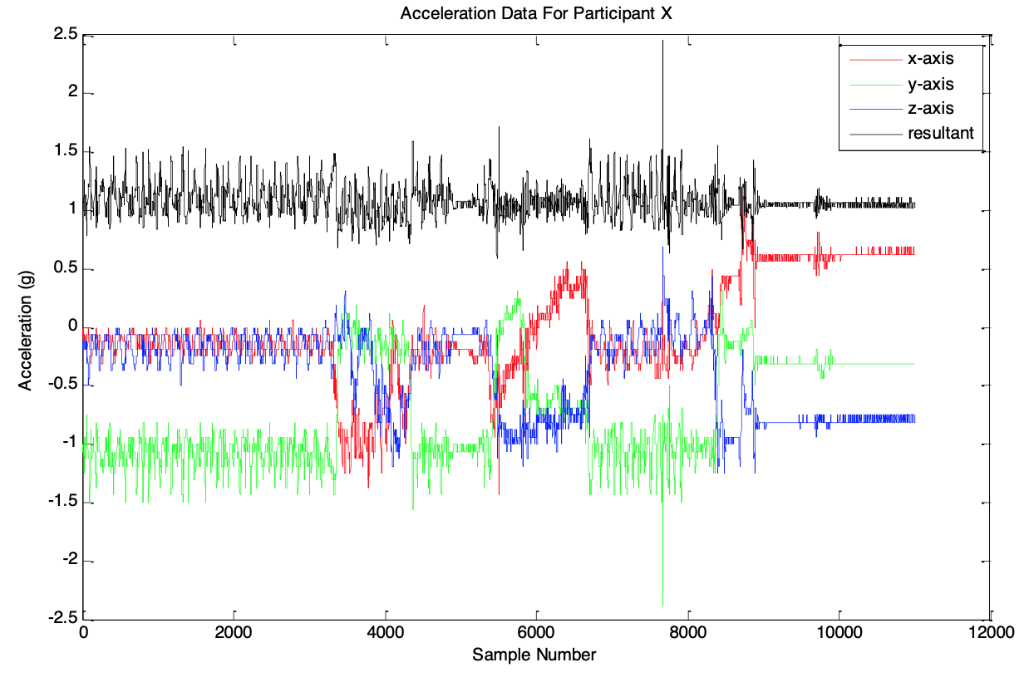
Acceleration Data For Participant X 2.5 x-axis y-axis Z-axis resultant 2 1.5 0.5 CO -0.5 IL -2 -2.5 2000 4000 6000 Sample Number 8000 10000 12000
Step by Step Solution
There are 3 Steps involved in it
Step: 1

Get Instant Access to Expert-Tailored Solutions
See step-by-step solutions with expert insights and AI powered tools for academic success
Step: 2

Step: 3
Ace Your Homework with AI
Get the answers you need in no time with our AI-driven, step-by-step assistance
Get Started
Postgresql 16 Administration Cookbook Solve Real World Database Administration Challenges With 180+ Practical Recipes And Best Practices
Authors: Gianni Ciolli ,Boriss Mejias ,Jimmy Angelakos ,Vibhor Kumar ,Simon Riggs
1st Edition
1835460585, 978-1835460580