

Question
I am having trouble relating the financial ratios to the suggestions, can you please explain how these would affect the the three recommendations given. Moreover,
I am having trouble relating the financial ratios to the suggestions, can you please explain how these would affect the the three recommendations given. Moreover, which ratios will be needed or used?
Below is a company summary, financial information and data as well as resources provided below! Please provide a clear step-by-step explanation (preferable). Thanks.
Boston Beer Company: Competition in the Craft Brewing Industry in 2017 It is January 17, 2020, and the Board of Directors of Boston Beer Company has employed you as a consultant to assess the company's current situation and recommend a set of actions to maintain the company's current growth in revenues and profitability.
Boston Beer Company's Board of Directors that sets performance targets and makes action recommendations that the company needs to follow to meet the aggressive revenue and earnings targets set by you, the consultant.
There were clear signs that the company was on the right track. Writing to the company's shareholders in Boston Beer Company's Annual Report, Jim Koch, Chairman and Founder of Boston Beer Company, had this to say about annual 2018 results:
"We're happy to say that 2018 was a year of rapid expansion and our sales increased by double digits. We may have made it look easy, but this kind of rapid expansion doesn't happen without bumps and challenges."
Maintaining double digit levels of annual sales growth and profitability for the company was a very challenging task. There were very clear signs of saturation in the U.S. craft brew market, and sales of Alcohol-Added Seltzers (Truly Hard Seltzer) and Alcohol-Infused Teas (Twisted Tea) for Boston Beer Company had become a fast-growing part of overall sales. Boston Beer management was also concerned with a sales slowdown in their core craft beer products, such as Samuel Adams beer.
As the company's consultants, make recommendations that maintain the company's strong annual growth and positive earnings.
You are tasked specifically with the following:
(1) Setting revenue targets for 2020 and 2021 that meet or exceed 20% growth,
(2) Setting Earnings per Share (EPS) targets for 2020 and 2021 that meet or exceed 20% earnings growth,
(3) Making two (2) recommendations that make it possible for the company to achieve these ambitious revenue and EPS targets, and
(4) Making one (1) recommendation that returns the core craft beer brands to positive sales growth. Your recommendation can focus on one Boston Beer product line (e.g. Samuel Adams, Dogfish Head Brewery, etc.) or can cover multiple product lines for the company.
Your recommendations should be specific and be clearly supported by your analysis of the company's financial situation.
Please use an appendix or financial analysis to support everything that contains
(a) an analysis of the company's financial statements and/or pro-forma financial projections and
(b) other appendices that you consider appropriate.
If citations are used please include a bibliography or references.
(1) Setting revenue targets for 2020 and 2021 that meet or exceed 20% growth,
(2) Setting Earnings per Share (EPS) targets for 2020 and 2021 that meet or exceed 20% earnings growth
(3) Making two (2) recommendations that make it possible for the company to achieve these ambitious revenue and EPS targets, and
(4) Making one (1) recommendation that returns the core craft beer brands to positive sales growth. Your recommendation can focus on one Boston Beer product line (e.g. Samuel Adams, Dogfish Head Brewery, etc.) or can cover multiple product lines for the company.
Revenue Target Fiscal 2020:________________________
EPS Target Fiscal 2020:________________________
Discussion:
Revenue Target Fiscal 2021: ________________________
EPS Target Fiscal 2021:________________________
Discussion:
Please use the following summary:
BOSTON BEER COMPANY
__________________________________________________________________
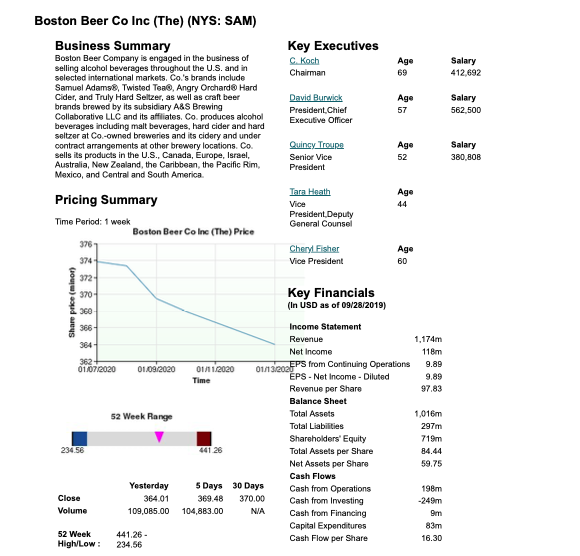
What is the ticker symbol for this company? NYS: SAM
Where is this company's World Headquarters located?
One Design Center Place, Suite 850, Boston, Massachusetts
Who is the CEO (Chief Executive Officer) of this company? David Burwick
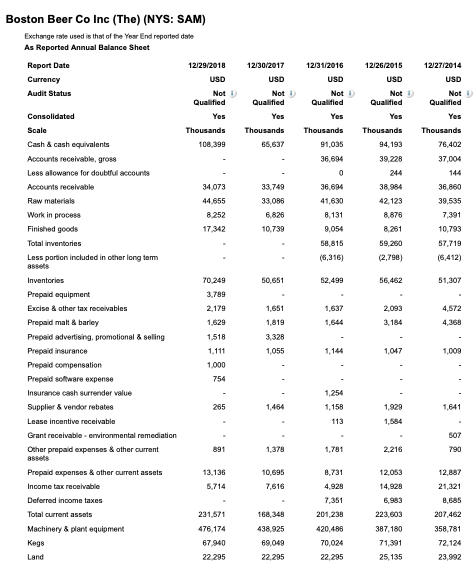
What were the annual net revenues for this company as of 12-29-2018?
(Hint: Use Mergent Online & Report in billions of dollars)
1,057,459,000
What was the company's annual net sales CAGR (in %) between 12-27-2014 and 12-29-2018?
Net Revenues CAGR was 2.47%
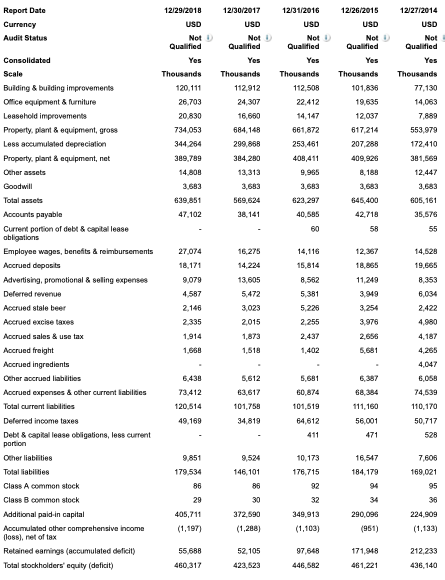
What was this company's ROE (return on stockholder's equity) as of 12-29-2018? (Hint: Calculate from Mergent Online; do not use pre-calculated ratios)
ROE was 20.13%
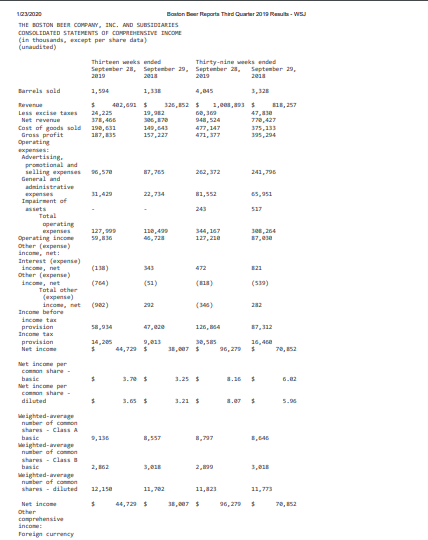
What was this company's EPS (earnings per share, fully diluted) as of 12-29-2018? (Hint: on Mergent, from the Income Statement, the line is Net Income per Share - diluted. Report as $x.xx per share).
EPS diluted is $7.82
Which of the 5 generic strategies described in Chapter 5, Figure 5.1 of the Gamble Textbook best describes the competitive strategy of Boston Beer Company? Why? Describe in one paragraph.
I believe that Boston Beer Co. uses a best cost provider strategy due to their desire to create high quality beer.Coch started this company in his kitchen, and eventually grew to one of the top beer companies in the world.Even though it grew larger than he expected, he doesn't skimp on quality.By doing this, customers feel more value for their money by satisfying customers expectations on quality while still paying a reasonable price for their product.
Briefly describe in one full paragraph this company's business and operations. (What does this company do?) (Hint: Use Value Line or Mergent Online).
The Boston Beer Co. produces seasonal and year-round varieties of craft-brewed beers and hard cider and seltzers. The company brews its core beers in breweries located in MA, PA, and OH. It offers variety of beers under the Samuel Adams name, flavored malt beverages under the Twisted Tea name, hard cider beverages under the Angry Orchard name, and hard seltzers under the Truly Hard Seltzer name. Boston Beer sells approx. 4.3 million barrels of its products a year. Has 1,439 employees. Off. and dir. own 29.2% of common stock (4/18 Proxy). Chairman: C. James Koch. Pres. & CEO: David Burwick. Inc.: Massachusetts Addr.: 1 Design Center Place, Suite 850, Boston, MA 02110. Telephone: 617-368-5000. Internet: www.bostonbeer.com.
What is the Fiscal 2019 EPS (Earnings per share) forecast for this company? (Hint: Use Value Line Investment Survey for Boston Beer Co. dated 04-19-2019. Report as $x.xx per share).
Projected 2019 EPS is $8.65
Does Value Line rate this stock as a good long-term investment? State Yes or No and explain your conclusion (Hint: Use Value Line Investment Survey for Boston Beer Company dated 04-19-2019).
Yes, Value line would agree that Boston Beer Co would be a good investment stock.They started out on a "good note" for 2019.They do predict some "headwinds" as the craft beer market continues to grow, but also has increase in competition form the increase in spirits and wine markets.Rising costs of beer puts pressure on profits, and there is a continual increase in newcomers to the craft beer industry.
Value Line does feel that Boston Beer Co. has a good strategic plan and has a history for responding to the changing market effectively. Boston Beer is investing in new growth opportunities, including new health-conscious products. These will include products for marathon runners which will include healthier beer options and alcoholic kombucha. The upcoming few years have a good outlook, but 3-5 years out are uncertain.
What does the Chief Executive Officer for your company state is the company's strategic plan going into 2019 and beyond? Briefly summarize the company's goals in one or two full paragraphs. (Hint: Use Boston Beer Company 2018 Annual Report, pages 2-3).
In 2018, Boston Beer Co did well with launching 2 new beers and adding a new President o their crew.They did so well with adding new flavors in 2018, that they have decided to add 2 more for 2019. "We have two unique products slated to launch in 2019: Tura Alcoholic Kombucha, a unique organic, light and refreshing shelf-stable alcoholic kombucha with live probiotics and real fruit, and Wild Leaf, a new craft hard tea with lower calories and sugar".
They did well with the growth of Truly Hard Seltzer. They established aggressive sales goals for 2018, but not aggressive enough, as they achieved their annual sales goal by the end of July.So, for 2019, they are doubling their sales targets. Boston Beer Co will continue to focus their innovation on high quality craft beer and other products that offer alternatives to wine and spirits to keep drinkers in the larger beer space. They expect the number of tap rooms to grow in 2019, so they plan on opening Samuel Adams Tap Room near the Faneuil Hall Marketplace, just steps from the statue of our namesake Patriot Samuel Adams. This Tap Room will have 20 draft lines, 8.5-barrel capacity, and seating for 600 people. They expect to open doors there by late 2019.
Industry Questions
What is the name of your company's primary industry? (Hint: Use Ibis World)
Craft Beer Production in the U.S.
_________________________________________________________________
What is this industry's primary NAICS code, according to Ibis World?
42481 Beer Wholesaling in the US
What are the primary products and/or services for this industry?
There are many different types of beer:
IPA- India pale ale
Belgian witbier (Belgian white)
Seasonal
Lager
Pale Ale
Wheat beers, fruit beers, stout, porter and others
What company has the largest market share in this industry and what is their US market share?
Boston Beer Co has the largest market share in the industry at 11%
What were the total sales (revenues) for this industry in 2018? (Hint: Use Ibis World, Industry Data Table. Report sales in $ billions).
2018 Market Revenue was $67,594,000,000
What are the Demand Determinants of this industry? Briefly summarize these key demand determinants. (Hint: Use Ibis World).
Consumers like nice things, especially if they are perceived to be a better quality like craft beer. However, they are sensitive to a few factors like
unemployment levels and per capita disposable income, which influences consumer spending. When income levels are down, people tend to spend less on discretionary purchases of craft beer. Several other factors drive demand for craft beer, including changing consumer preferences, public attitudes relating to alcoholic beverages, per capita alcohol consumption and demographic trends. Changes in consumer preferences have a significant impact on this industry. If the markets for wine, spirits, hard cider or flavored alcoholic beverages continue to grow, this could draw consumers away from craft beer.
What are the Key Success Factors for this industry? Briefly summarize these key success factors. (Hint: Use Ibis World).
The main success factors are:
Establishment of brand names- Successful branding through logo design, labeling and advertising is critical to success in a brand competitive market
Control of distribution networks- New entrants must have access to distribution networks including wholesale distributors to get their beer sold at restaurants, bars and other retail locations.
Marketing of products- Innovative and offbeat branding, packaging and marketing help operators differentiate their craft beer from corporate brands
Effective quality control- Quality and taste are important competitive factors among craft breweries. Operators need to keep flavors consistent batch after batch and ensure high quality
Management of seasonal production- In addition to brewing year-round flavors, producers must continually rotate several additional beer styles every few months to take advantage of increasingly popular seasonal drinking trends
Briefly summarize the Current Performance of this industry over the last five years. (Hint: Use Ibis World)
The Craft Beer Production industry has transformed into one of the fastest growing and most popular alcoholic beverage segments in the United States. The industry has experienced significant revenue growth over the five years to 2018, increasing at an annualized rate of 11.8% to reach an estimated $6.8 billion, including estimated growth of 2.0% in 2018 alone.
What is the level of globalization in this industry? What is the Trend? Discuss why in one or more paragraphs. (Hint: Use IBIS World, Industry Globalization section of report).
The Craft Beer Production industry has a low level of globalization and essentially did not export any of its craft beer products prior to the previous decade. Craft beers tend to be produced in small batches and consumed locally, but the rapid increase in demand for craft beers has enabled many microbrewers to expand operations, negotiate competitive regional shipping contracts with major distributors and even supply the international market with craft beer. As domestic breweries expand production to satisfy foreign and domestic demand, international trade of craft beer is projected to grow steadily over the next five years. In addition, a growing number of foreign craft breweries are projected to enter the industry as US consumers continue to explore the many styles of beer from different regions across the globe. Although the industry's globalization is still low, the newfound popularity of craft beer will lead to increasing globalization.
What was this industry's annual sales (revenue) growth rate from 2013 to 2018?
Annual Growth rate was 11.8%
What are the Major Markets for this industry's products? Which segment represents the largest market for this industry? Why? (Hint: use IBIS World, Products & Markets, Major Markets section).
They segmented the major markets into age groups:
Age 21- 34 represents 40.5%
Ages 35 to 44 represents 21.2%
Ages 45 to 54 represent 18%
Ages 55 and older represents 18.2%
Exports represent 2%
The younger population represents the largest market since they are more likely to drink beer than middle aged consumers.Many older consumers prefer wine and light beer over the craft brew industry. The younger group also represented the faster growth in the industry.
Which phase of the industry life cycle does this industry currently occupy? Why? Briefly summarize the industry life cycle in one paragraph. (Hint: Use Ibis World).
The craft beer industry is growing! It is projected to increase annually by 7% over the next 10 years. The US GDP is anticipated to grow an annualized 2.2% during the same 10-year period. Craft beer's popularity boosted its prominence on many store shelves, which further contributed to growing consumer awareness. Acquisitions within the industry occur occasionally but are limited. The number of industry establishments is forecast to grow at an annualized rate of 13.5% to 10,527 locations over the 10 years to 2023.
What is the forecast for this industry's sales and sales growth (in %) from 2019 to 2024? What is your evaluation of this growth rate forecast? Explain in two paragraphs. (Hint: use IBIS World, Industry Outlook section)
The projection of revenue growth from 2019 to 2024 is expected to increase from 68,672,000,000 in 2019 to $74,085,000,000 in 2024. This is represented by a consistent 2% increase in revenue over each year. Due to the increase of popularity, the craft beer industry needs to be innovative to keep the interest and demand of its consumers. These projections also would account for new entrants joining the craft brewing industry. As demand increases, then people are more apt to try their hand at making their own.
My husband and brothers-in-laws are all very much into craft beer and are willing to try each new flavor that they can find. Some are definetly better than others, but beer is their passions, just like many others in this country.Its not just about drinking beer. Its an adventure and a quest to seek out beers that they have never tried before.
Step by Step Solution
There are 3 Steps involved in it
Step: 1

Get Instant Access to Expert-Tailored Solutions
See step-by-step solutions with expert insights and AI powered tools for academic success
Step: 2

Step: 3
Ace Your Homework with AI
Get the answers you need in no time with our AI-driven, step-by-step assistance
Get Started
Quantitative Analysis For Management
Authors: Barry Render, Ralph M. Stair, Michael E. Hanna
11th Edition
9780132997621, 132149117, 132997622, 978-0132149112